Figures & data
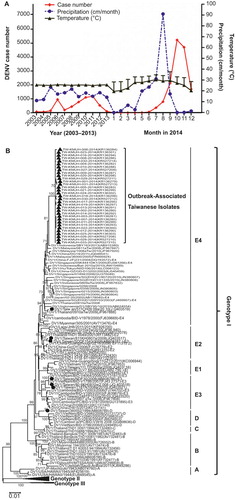
Figure 1 Dengue virus outbreaks in Taiwan in 2014. (A) The accumulative dengue infection cases in the past decade reported by Taiwan CDC (left) and reported cases monthly in 2014 (right) in Kaohsiung city. The association of dengue case numbers with temperature and precipitation is also illustrated. The asterisk “*” indicates the time of gas explosion in Kaohsiung city. (B) Phylogenetic tree analyses of Taiwanese 2014 dengue outbreak-associated isolates. The nucleotide sequences of complete E-genes of DENV strains were aligned, edited, and analyzed using ClustalW software. The phylogenetic analysis was performed using MEGA version 5 (http://www.megasoftware.net/). Consensus neighbor-joining trees were obtained from 1000 bootstrap replicates. The black filled triangles indicate 2014 Taiwanese outbreak-associated isolates and the black-filled circles indicate previous Taiwanese DENV-1 endemic or epidemic strains.