Figures & data
Table 1 List of bacterial strains used in this study
Figure 1 Development and validation of automated high-throughput bacterial growth assay (HIGA). (A) Diagram of standard susceptibility assay and high-throughput antibiotic screening method timelines. (B) Endpoint growth assay for K. pneumoniae (KPNIH301), A. baumannii (ABNIH144), P. aeruginosa (PANIH338), C. freundii (CFB10), E. cloacae (ECB2) and E. coli (ECOB11); n=32. Bars represent mean, and error bars represent the SD. (C) Growth curve of K. pneumoniae KPNIH301 in 1536-well plate. Frozen KPNIH301 were diluted to different starting ratios and incubated at 37 °C. Data points represent the mean, and error bars represent the SD; n=3. (D) Time course of KPNIH301 growth in the presence of 46 μM ciprofloxacin or 0.46% dimethylsulphoxide (DMSO). Data points represent individual experiments; n=3. *X axis is not linear. (E) Dose–response curves for ciprofloxacin. KPNIH301 was incubated with varying concentrations of ciprofloxacin at 37 °C for 6, 8, 10 and 20 h. The data points represent the mean, and error bars represent the SD; n=3. (F) Concentration–response curves for ciprofloxacin in 96-well, 384-well, 1536-well absorbance assay (AB) and ATP content luminescence assay (LM). KPNIH301 was incubated with different concentrations of ciprofloxacin for 8 h at 37 °C before detection at OD600. The data points represent the mean, and error bars represent the SD; n=3. (G) Scatter plot of the results from a DMSO plate screening. The wells in column 1 of the 1536-well assay plates contained 46 μM ciprofloxacin as a positive control (0% viability); the wells in column 3 contained varying doses of ciprofloxacin at 1:3 serial dilutions from top to bottom. The wells in the rest of plate contained DMSO as a negative control (100% viability). The signal-to-basal ratio (S/B) in this plate was 10.6-fold, with a coefficient of variation (CV) of 8% and a Z′ factor of 0.61.
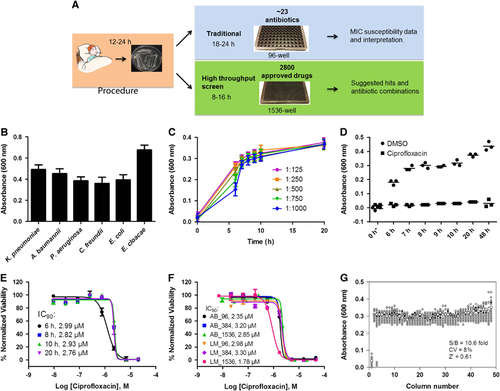
Figure 2 Concentration–response curves of the inhibition of K. pneumoniae KPNIH1760 growth by 25 identified active compounds. The 25 compounds with confirmed antibacterial activity are divided into six groups: (A) antibiotics; (B) antifungals; (C) antirheumatics; (D) antimalarial and anti-HIV; (E) antiseptics; (F) anticancer and NADPH oxidase inhibitor; n=4. Data points represent mean, and error bars represent the SEM.
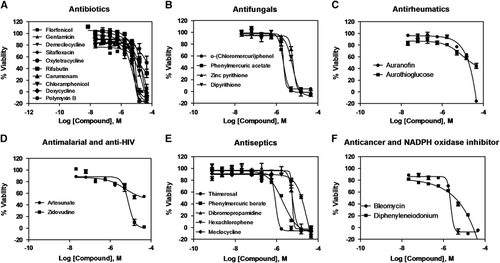
Table 2 Activity of 11 FDA-approved drugs against four Klebsiella pneumoniae strains
Table 3A Comparison of MIC values from the standard broth microdilution assay and IC90 values of active compounds against K. pneumoniae KPNIH1760
Figure 3 Active compounds re-sensitize K. pneumoniae KPNIH1760 to standard care antibiotics. In the drug combination conditions, compounds underlined are plotted in dose–response. Concentration–response curves were generated for the drug combinations indicated. KPNIH1760 was treated with gentamicin (Gent) (10 μM), polymyxin B (Poly B) (IC20) or doxycycline (Doxy) (IC20), combined with varying concentrations of polymixin B, auranofin (Auran), chloramphenicol (Chlor) or colistin for 24 h at 37 °C before detection of bacterial growth at OD600 (green line). (A, B) In combination with 10 μM gentamicin, IC50 of polymyxin B was improved from 44 to 2.62 μM (3.41 μg/mL) (IC90 of 5.74 μM (7.46 μg/mL)); IC50 of auranofin was improved from 20 to 1.01 μM (686 ng/mL) (IC90 of 1.67 μM (1.13 μg/mL)). (C) In combination with 5 μM polymyxin B, IC50 of chloramphenicol was lowered from 24 to 3.65 μM (1.18 μg/mL) (IC90: 4.47 μM (1.44 μg/mL)). (D) In combination with 5 μM doxycycline, IC50 of colistin was lowered from >46 μM to 658 nM (759 ng/mL) (IC90: 786 nM (909 ng/mL)). Three-drug synergistic targeted drug combinations (TDCs) against KPNIH1760 (E, F). Single drug, three-drug combination or dimethylsulphoxide (DMSO) (vehicle control) was plotted with drug concentration (green bars) and corresponding % normalized viability (black bars). Antimicrobial susceptibility breakpoint of the single drug was indicated (red line). (E) Synergistic bactericidal effect of the three-drug combination: rifabutin (Rifa)—0.09 μg/mL, polymyxin B (Poly)—1.3 μg/mL and gentamicin (Gent)—2.39 μg/mL against KPNIH1760. (F) Synergistic bactericidal effect of the three-drug combination: colistin—1.96 μg/mL, auranofin (Auran)—0.67 μg/mL and ceftazidime (Ceft)—8.20 μg/mL; n=4. Bar graph represent mean, and error bars represent the SEM.
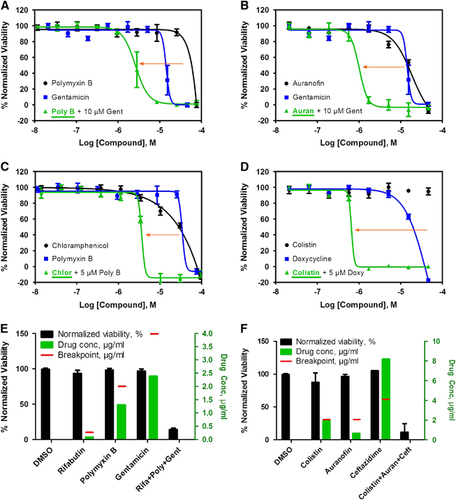
Table 3B MIC values of three drugs against MDR E. coli ECOB11 from the standard broth microdilution assay
Figure 4 Broad-spectrum bactericidal effects of three-drug combinations. Fifteen three-drug targeted drug combinations (TDCs) were tested at their IC90 concentrations against 10 multidrug-resistant strains, including K. pneumoniae (KPNIH776 and KPNIH892), A. baumannii (ABNIH144, ABNIH233 and ABNIH333), P. aeruginosa (PANIH338 and PANIH668), C. freundii (CFB10), E. cloacae (ECB2) and E. coli (ECOB11). (A) Heatmap of bactericidal effects of 15 TDCs against 10 MDR bacteria; 0% viability (red), 20% viability (white), 50% viability (blue) and 100% viability (black). Comb1 (rifabutin—0.052 μM, polymyxin B—1 μM and zidovudine—1 μM); Comb2 (rifabutin—0.056 μM, polymyxin B—1 μM and trimethoprim—4 μM); Comb3 (rifabutin—0.056 μM, polymyxin B—1 μM and aztreonam—4 μM); Comb4 (rifabutin—0.06 μM, polymyxin B—1 μM and ceftazidime—15 μM); Comb4* (rifabutin—0.06 μM, polymyxin B—1 μM and ceftazidime—4 μM); Comb5 (rifabutin—0.09 μM, polymyxin B—1 μM and imipenem—16 μM); Comb5* (rifabutin—0.09 μM, polymyxin B—1 μM and imipenem—8 μM); Comb6 (rifabutin—0.052 μM, colistin—2.1 μM and zidovudine—1 μM); Comb7 (rifabutin—0.056 μM, colistin—2.1 μM and trimethoprim—4 μM); Comb8 (rifabutin—0.056 μM, colistin—2.1 μM and aztreonam—4 μM); Comb9 (rifabutin—0.06 μM, colistin—2.1 μM and ceftazidime—15 μM); Comb9* (rifabutin—0.06 μM, colistin—2.1 μM and ceftazidime—8 μM); Comb9# (rifabutin—0.06 μM, colistin—2.1 μM and ceftazidime—4 μM); Comb10 (rifabutin—0.09 μM, colistin—2.1 μM and imipenem—16 μM); Comb10* (rifabutin—0.09 μM, colistin—2.1 μM and imipenem—8 μM); Comb11 (colistin—1.2 μM, auranofin—1 μM and imipenem—16 μM); Comb11* (colistin—1.2 μM, auranofin—1 μM and imipenem—8 μM); Comb12 (colistin—1.9 μM, auranofin—1 μM and rifabutin—0.2 μM); Comb13 (colistin—1.7 μM, auranofin—1 μM and ceftazidime—15 μM); Comb13* (colistin—1.7 μM, auranofin—1 μM and ceftazidime—8 μM); Comb13# (colistin—1.7 μM, auranofin—1 μM and ceftazidime—4 μM); Comb14 (colistin—2.1 μM, auranofin—1 μM and zidovudine—1 μM); Comb15 (polymyxin B—1.8 μM, auranofin—1 μM and ceftazidime—15 μM); Comb15* (polymyxin B—1.8 μM, auranofin—1 μM and ceftazidime—8 μM); Comb15# (polymyxin B—1.8 μM, auranofin—1 μM and ceftazidime—4 μM); n=4; * and # represent the same drugs are in combination but with different concentrations. (B) Top three TDCs and dimethylsulphoxide (DMSO) control were plotted as % normalized viability of different MDR isolates: (i) colistin—1.96 μg/mL, auranofin—0.68 μg/mL and ceftazidime—8.20 μg/mL (green) (Comb13 in A; (ii) colistin—2.19 μg/mL, auranofin—0.68 μg/mL and rifabutin—0.17 μg/mL (blue) (Comb12 in A; (iii) rifabutin—0.08 μg/mL, colistin—2.43 μg/mL and imipenem—4.80 μg/mL (purple) (Comb10 in A; n=4. Bar graph represent mean, and error bars represent the SEM. (C) Clinical breakpointsCitation24, Citation29 and drug concentrations in three-drug TDCs. Bars represent drug concentrations of colistin (black), auranofin (green), ceftazidime (blue), rifabutin (purple) and imipenem (orange), and corresponding colored dashed lines represent individual drug susceptibility breakpoints. Breakpoints were selected for auranofinCitation30 and rifabutinCitation31 based on the selected literature. Imipenem and ceftazadime breakpoints were based on CLSI guidelines for Enterobacteriaceae. Imipenem breakpoint is 2 μg/mL and ceftazadime breakpoint is 8 μg/mL for Acinetobacter spp. and Pseudomonas spp.Citation24
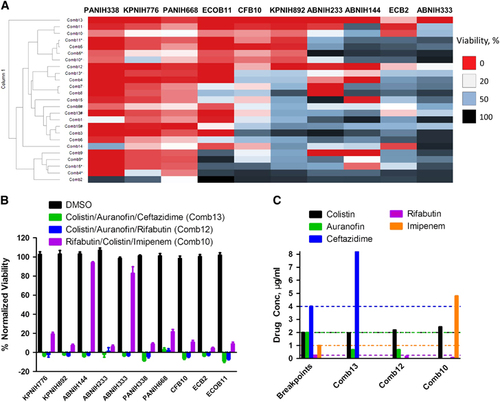
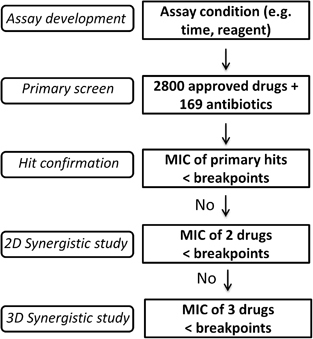
Figure 5 Flow chart of future rapid antimicrobial susceptibility tests for treatment of multidrug-resistant organisms. (i) The first step is assay development, including reaction time and assay reagents. (ii) The second step is large-scale screening of available antibiotics and other approved drugs. (iii) The third step is confirmation of hits: any hits with >90% suppression of MDRB growth and a drug concentration below its clinical microbial susceptibility breakpoint may be investigated. (iv) The fourth step (optional) is two-drug (2D) TDC using the above confirmed hits with MIC90 above the clinical breakpoints and commonly used antibiotics. A 2D synergistic combination will be further investigated if its combined bactericidal effect is more than 90% and the drug concentration of each individual drug is no more than its breakpoint. (v) The fifth step (optional) is three-drug (3D) TDC using above 2D combinations with the MIC90 above the clinical breakpoints and commonly used antibiotics. A 3D synergistic combination is proposed as a potentially effective therapeutic combination if its combined bactericidal effect is beyond 90% and the drug concentration of each individual drug is below its clinical breakpoint.