
Figures & data
Figure 1 Map of sampling locations. Quarantines were located near the border with Sudan, abattoirs were in Cairo and the Nile Delta region, free herds and farms were in Northern Egypt.
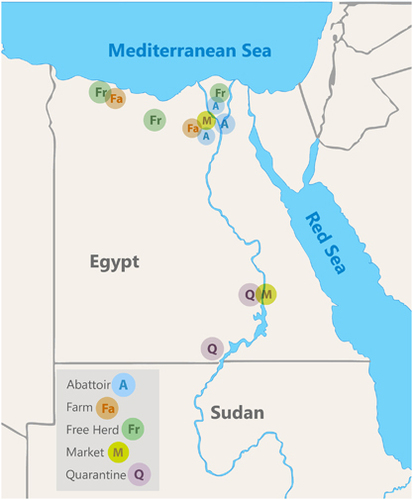
Table 1 MERS-CoV microneutralization and nasal swab RT-PCR test results by sampling site, age, sex and animal origin
Figure 2 Serological and viral RNA detection distribution of MERS-CoV in camels in Egypt over time. (A) Distribution of antibody titers by month. The y axis shows the percentage of seropositive samples (neutralizing antibody titer ≥1:20). (B) Detection of viral nucleic acids by month. The y axis shows the percentage of nasal swabs with confirmed MERS-CoV RNA by RT-PCR. All samples were included in the analysis. Supporting data are provided in Supplementary Table S2. Middle East respiratory syndrome coronavirus, MERS-CoV; polymerase chain reaction with reverse transcription, RT-PCR.
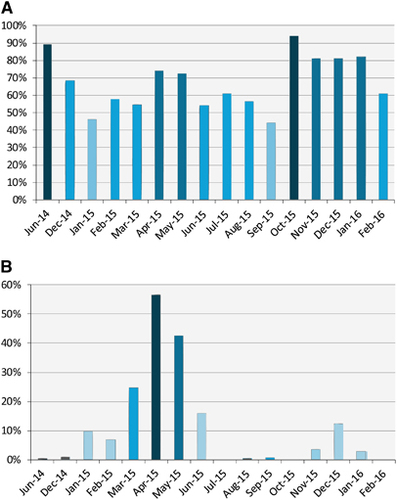
Figure 3 Phylogenetic tree of the partial Spike protein gene (around 600 bp) of MERS-CoV. Tree was generated using MEGA6 with bootstrap method and Kimura 2-parameter model. MERS-CoV/Camel/Egypt/NRCE-HKU205/2013 (KJ477102) was used as a root for the tree. Sequences obtained in this study are shown in red, other camel sequences are shown in blue. Middle East respiratory syndrome coronavirus, MERS-CoV.
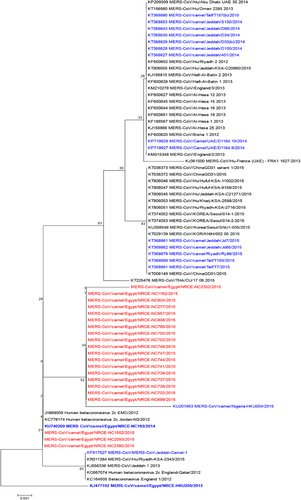
Figure 4 (A) Comparison of seroprevalence between local and imported camels by age and sex. Numbers in the circles indicate the percentage of seropositive samples (neutralizing antibody titer ≥1:20). Arrows indicate categories compared with each other. Statistically significant differences (P-value <0.05) are denoted by *. NS denotes not statistically significant. (B) Comparison of detection of viral RNA between local and imported camels by age and sex. Numbers in the circles indicate the percentage of nasal swabs with confirmed MERS-CoV RNA by RT-PCR. Arrows indicate categories compared with each other. Statistically significant differences (P-value <0.05) are denoted by *. NS denotes not statistically significant. Middle East respiratory syndrome coronavirus, MERS-CoV; polymerase chain reaction with reverse transcription, RT-PCR.
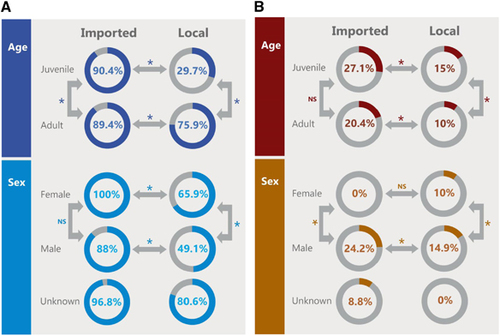
Figure 5 Detection of viral RNA in imported (A) and local (B) camels over the surveillance period. Y axes show the percentage of nasal swabs with confirmed MERS-CoV RNA by RT-PCR. Supporting data are provided in Supplementary Table S3. Middle East respiratory syndrome coronavirus, MERS-CoV; polymerase chain reaction with reverse transcription, RT-PCR.
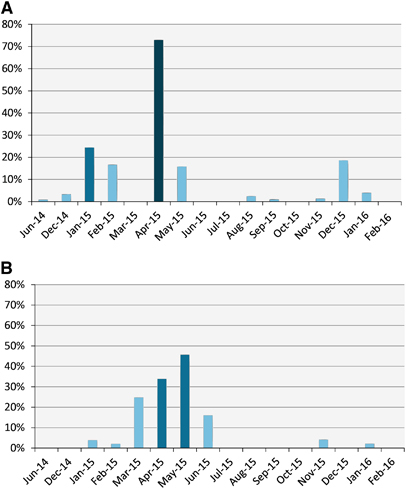
Figure 6 Epicurve of MERS-CoV outbreak in a local herd and the associated antibody geometric mean titers. Bars indicate the percentage of nasal swabs with confirmed MERS-CoV RNA by RT-PCR. Line indicates the geometric mean of antibody titers. Supporting data are provided in Supplementary Table S4. Middle East respiratory syndrome coronavirus, MERS-CoV; polymerase chain reaction with reverse transcription, RT-PCR.
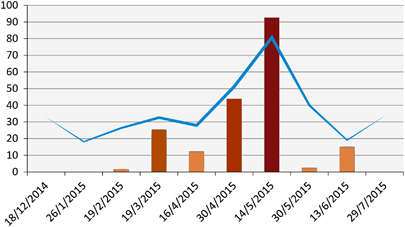
Table 2A MERS-CoV neutralizing antibody titers in matched mother–calf pairs
Table 2B Neutralizing antibody titers against MERS-CoV in re-infected camels