Figures & data
Table 1 Genome sequences of Zika virus strains in this study
Figure 1 Putative transmembrane domains in the Zika virus genome. Abbreviations: capsid, C; envelope, E; nonstructural, NS; pre-Membrane, prM.
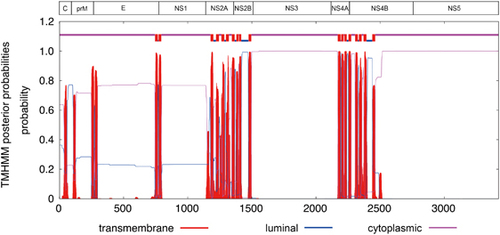
Figure 2 Comparative genomic analysis of the representative pre-epidemic and epidemic Zika virus strains. The results represent all 24 Zika virus strains unless otherwise specified (i.e., nuclear localization signals, and O-glycosylation and N-glycosylations sites). For the polymorphic sites, analysis was performed for all 24 Zika virus strains, but only the results of the three representative pre-epidemic African (Uganda 1947), pre-epidemic Asian (Malaysia 1966) and the epidemic (Brazil, 2015) strains are shown here. (A) Capsid (C), pre-Membrane (prM) and envelope (E); (B) nonstructural (NS) 1, NS2A, NS2B and NS3; (C) NS4A, NS4B and NS5. Abbreviation: DEAD-like helicase superfamily, DEXDc.
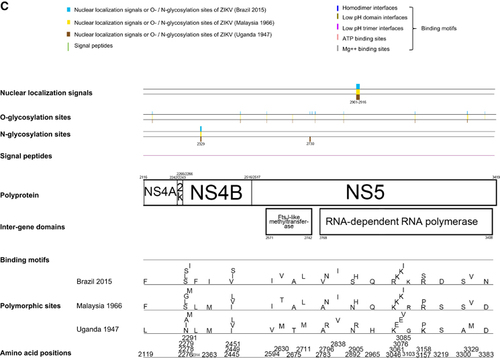
Table 2 Estimation of nonsynonymous and synonymous substitution rates in the 24 ZIKV genome sequences
Figure 3 Phylogenetic analysis of the ten structural and non-structural coding regions of 24 Zika virus strains, rooted by Spondweni virus, dengue virus serotype 2, and tick-borne encephalitis virus. The trees were constructed by the maximum likelihood method based on the Tamura-Nei model. The tree with the highest log likelihood is shown. Initial tree(s) for the heuristic search were obtained automatically by applying Neighbor-Joining and BioNJ algorithms to a matrix of pairwise distances estimated using the Maximum Composite Likelihood approach, and then selecting the topology with superior log likelihood value. The bootstrap values were calculated from 500 trees. The tree is drawn to scale, with branch lengths measured in the number of substitutions per site. The bootstrap values <60% are not shown. All Zika virus strains are labeled as follow: accession number/strain number/country/year. All strains represent Zika virus strains unless otherwise specified for Spondweni virus, dengue virus serotype 2 and tick-borne encephalitis virus. Abbreviation: nonstructural, NS.
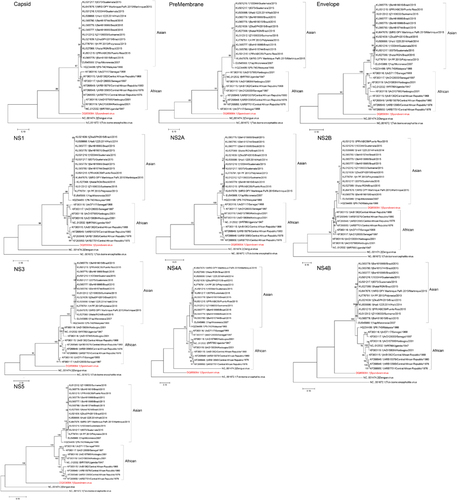
Figure 4 Genome organization and bootscan analysis of the Zika virus genomes. (A) Bootscanning was conducted with Simplot version 3.5.1 on a gapless nucleotide alignment, which was generated with ClustalX with the genome sequences of the available Asian lineage Zika virus strains as the query sequences. (B) Multiple alignment of the recombination fragment in NS2B nucleotide sequences of Zika virus strains MR766/Uganda/1947 (NC_012532.1) and Natal RGN/Brazil/2015 (KU527068.1), and Spondweni virus (DQ859064.1). In the Zika virus strains, only the nucleotides differing from those in Spondweni virus are depicted. The nucleotides in the Zika virus strains are highlighted in blue or red. Abbreviations: capsid, C; envelope, E; nonstructural, NS; pre-Membrane, prM.
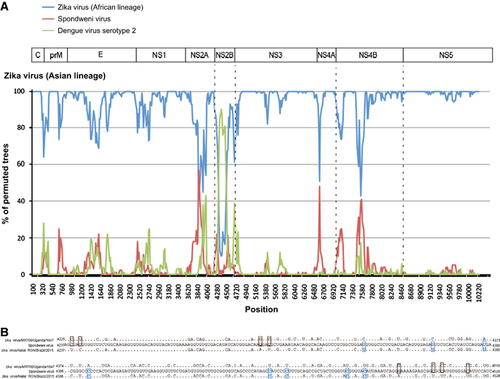
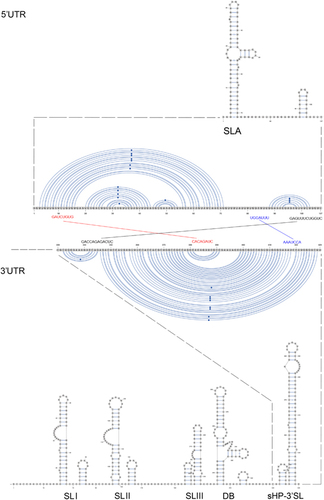
Figure 5 Schematic representations of the Zika virus genome RNA secondary structures. The short conserved 5′-ACAG-3′ sequences in the top loop of the sHP-3′ SL structure are indicated in red. Abbreviations: dumbbell, DB; open reading frame, sHP-3'-ORF; small hairpin 3'-stem-loop, sHP-3' SL; stem loop, SL; Y-shape stem-loop, SLA; untranslated region, UTR.
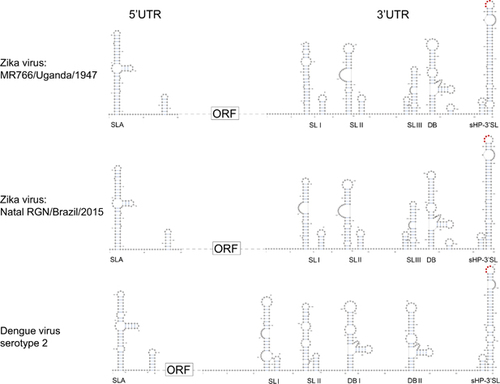
Figure 6 Terminal region genome sequences that are involved in 3′–5′ long distance RNA–RNA interactions. The three pairs of inverted complementary sequences that may mediate genome cyclization and allow the RdRp to reach the 3′ SL initiation site for RNA synthesis are enlarged. Abbreviations: dumbbell, DB; open reading frame, sHP-3' ORF; small hairpin 3'-stem-loop, sHP-3'-SL; stem Loop, SL; Y-shape stem-loop, SLA; untranslated region, UTR.