Figures & data
Table 1 Overview of sampling effort from 2013 to 2015
Figure 1 Influenza prevalence by time and location; USA sampling is graphed in dark gray, Canadian (CAN) sampling is graphed in light gray. Absence of virus is marked at 0%; absence of sampling is marked as not applicable (NA). Each data set is derived from a range of 8–126 individuals, bars represent ±SE of the prevalence estimate (A, C). The percentage of animals where AI was detected in at least one of the three swab sites is shown in A; percentage of seropositive animals is shown in C. The proportion of positive samples derived from each physiologic site (rectal, conjunctival and nasal) is shown in B. Animals are grouped by infection status based on seroprevalence (sero) and detection of viral RNA (virus): negative by both serology and RTPCR (blue), positive by both serology and RTPCR (purple), seropositive and RTPCR negative (pink), seronegative and RTPCR positive (green). The proportion of animals in each infection status are shown based on age class (pup molt stages II–V, vs mature animals), relative sampling effort per group is represented by the width of the bars (D).
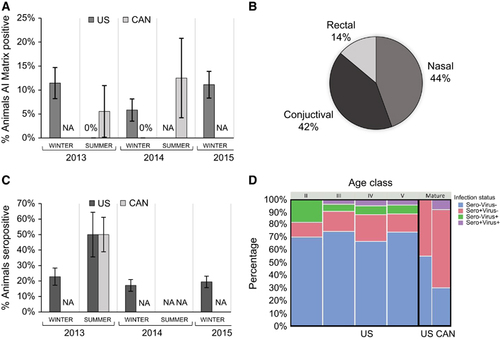
Figure 2 Animals are grouped by infection status based on seroprevalence (sero) and detection of viral RNA (virus). Graphed from left to right are sero/virus −/−, +/−, −/+, +/+. Each animal is shown as a single data point representing the Smirnov body condition index of girth × 100/length; immature animals (blue), mature animals (red). Whisker and box plot represent 5th and 95th quartiles.
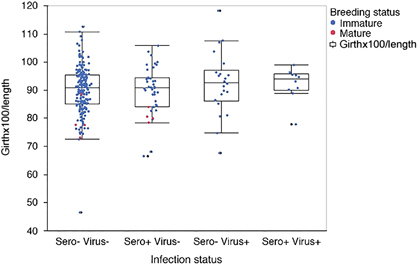
Figure 3 Movement of IAV positive and negative adult gray seals tagged in the summer of 2013 at either Sable Island, Canada (orange dot) or Chatham, MA (green dot). Additional animals were sampled without tagging on Muskeget, MA (yellow dot) (A). For each location, Chatham, MA (B, C) and Sable Island, Canada (D, E) the movement data for animals testing negative for influenza are shown on the top (B, D) and those testing positive are shown on the bottom (C, E). Tagged animals at each location were analyzed according to infection status: negative, or positive (sero+/virus−, sero−/virus+, sero+/virus+ denoted on the legend) (F, G). The 95% home range for animals tagged at Chatham, MA is shown as a scatter plot denoting the mean and standard error of the mean. (F). The foraging effort (FE) of positive and negative animals is shown as a scatter plot (G); the mean and SEM are shown. FE is calculated as hours at the lowest depth divided by sampling days.
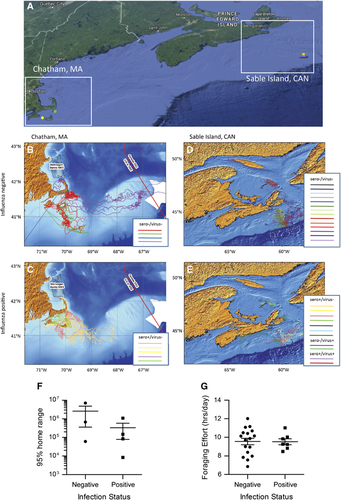
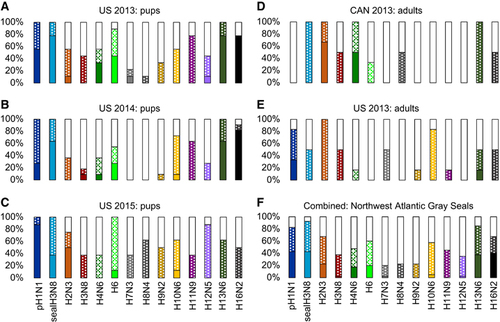
Figure 4 Sera from seropositive animals were tested for the ability to inhibit virus-driven hemagglutination of chicken erythrocytes. The virus panel represents human pH1N1, seal H3N8, and 12 avian viruses. For each subtype, the proportion of animals that failed to inhibit the virus are shown in white (≤1:8), moderate inhibition as a dotted pattern (1:16–1:64), and strong inhibition as a solid bar (≥1:128). Animals are grouped by sampling year (2013, 2014 or 2015) and location (Cape Cod, MA, USA or Sable Island, Canada) (A–E). Combined data for all animals tested is shown in F.