
Figures & data
Figure 1 Schematic diagram and analogous three-dimensional (3D) structure of the MERS-CoV S protein. (A) Amino acid sequences of the recombinant proteins (rNTD, rRBD, rS1, rS2 and rS) evaluated in this study. The NTD region of focus in this study is indicated by a red triangle. (B) The 3D structure of the MERS-CoV S protein was predicted using PyMOL, and the side view or transverse view is shown based on the trimeric S structure of HKU1.Citation18 N-terminal domain (NTD), RBD, S2 and the 367–606 and 606–751 aa regions are colored in light blue, dark blue, orange, red and green, respectively.
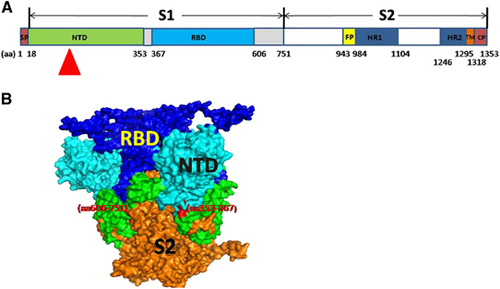
Figure 2 The isolated mAbs exhibited different binding affinities and neutralizing potencies to MERS-CoV. (A) These mAbs (5F9, 2B4, 7D7, 1F4, 3A2, 4A6, 4F8, 4C5 and 1B5) were mapped to different regions of the MERS-CoV S protein using ELISA. rS, rS1, rS2, rRBD and rNTD were used at a concentration of 1 μg/mL. (B) Inhibition of pseudovirus MERS-CoV entry into Huh7.5 cells by the isolated mAbs. Each of the selected mAbs (1 μg/mL), anti-N9 mAb (1 μg/mL) and anti-serum (1:10 000) were evaluated for their neutralizing activity against pseudotyped MERS-CoV after incubation with 293FT cell surface-expressing MERS-CoV S proteins. Neutralizing activity was defined as occurring when the inhibition percentage exceeded 50%. The results shown are representative of three independent experiments. N-terminal domain, NTD.
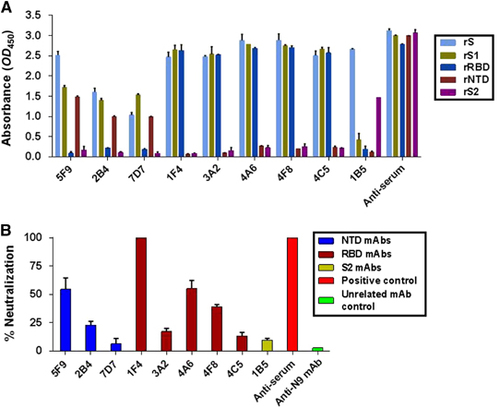
Figure 3 The 5F9 antibody bound to the rNTD with high affinity. Recombinant proteins at 1 μg/mL were used to coat plates overnight at 4 °C, and each of the mAbs was serially diluted in PBS and assessed for binding affinity and specificity to MERS-CoV rNTD (A) and rRBD (B). (C) The binding kinetics between 5F9 and rNTD using SPR. The Ka and KD values were calculated from sensograms using five rNTD concentrations (60, 30, 15, 7.5 and 3.25 nM). The results shown are representative of three independent experiments. Anti-RBD, anti-N9 mAb and PBS were used as the positive, unrelated and blank controls, respectively. N-terminal domain, NTD.
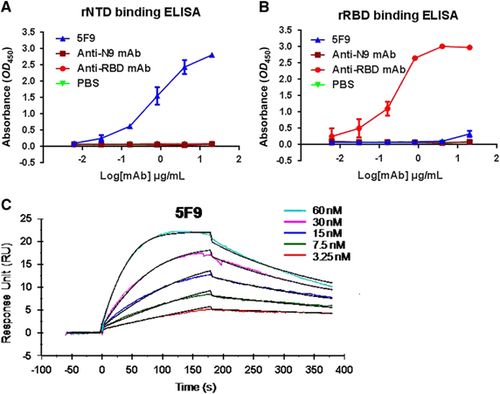
Figure 4 Potent in vitro neutralization of MERS-CoV by 5F9 mAb. (A) Neutralization of pseudotyped MERS-CoV. DPP4-expressing Huh7.5 cells were cultured with 200 TCID50 pseudotyped MERS-CoV in the presence of serially diluted mAbs. The neutralizing percentage was calculated by measuring luciferase expression compared to the pseudovirus-infected cell control. (B) Neutralization of live viruses. Different concentrations of the mAbs were pre-cultured with the live viruses (HCoV-EMC) in Vero E6 cell monolayers. The neutralization percentage was evaluated by calculating the decrease in PFU number compared with the virus-infected control. (C) PFU images of viral infection in the presence of the mAbs on day 3. The images correspond to the neutralizing percentages in B. Approximately 30–35 PFU virus stocks (HCoV-EMC) were used to infect Vero E6 cells in a 12-well plate with or without mAbs. The results shown are representative of three independent experiments. Anti-RBD and anti-N9 mAbs were used as positive and unrelated controls, respectively.
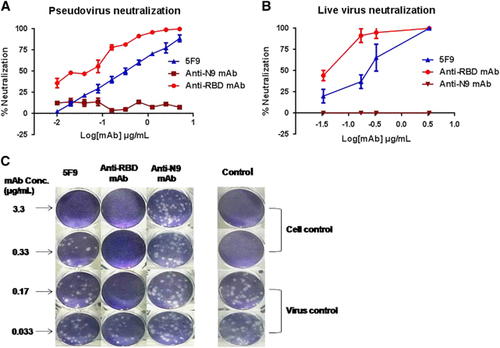
Figure 5 Binding abilities of 5F9 to denatured MERS-CoV rS, rNTD and synthetic peptides spanning the NTD. (A) Western blot analysis of mAb 5F9 bound to denatured rS and rNTD. Lane rS, 1 μg denatured rS protein (aa 1–1297); Lane rNTD, 1 μg denatured rNTD (aa 18–353). Pre-fusion mouse serum (anti-serum) was used as a positive control. (B) Binding of 5F9 to overlapping 18 aa peptides. P2 to P44 (18 aa peptides) correspond to numbers 2 to 44 in Supplementary Table S1. Each peptide was coated onto a 96-well plate at 250 ng/well, and the mAb was evaluated at a concentration of 1 μg/mL. The results shown are representative of three independent experiments. N-terminal domain, NTD.
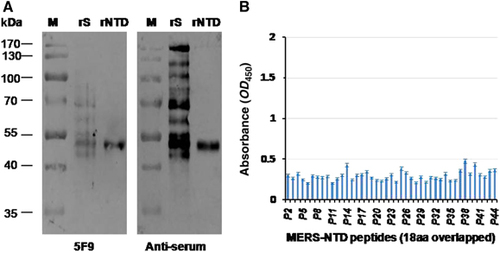
Table 1 Characterization of the mAbs against MERS-CoV in this study