Figures & data
Table 1 T-cell epitopes predicted by TEpredict and IEDB
Figure 1 SDS-PAGE and Western blot analysis to detect the purified recombinant Rv2351c protein expression. Lanes: A/E, Standard protein marker; B, non-induced pET-32a-Rv2351c; C, induced pET-32a-Rv2351c; and D/F, purified recombinant Rv2351c protein.
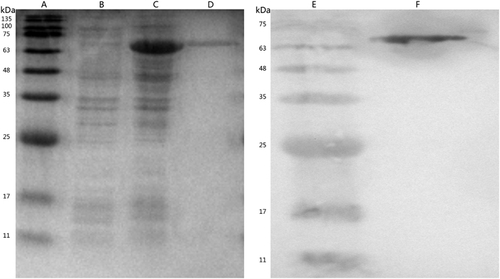
Table 2 Baesline data of the participants enrolled in the study
Figure 2 Response magnitude of different subjects against cocktail peptides and Rv2351c in the ELISpot assay. Sixty-one patients with active TB, 38 patients with no TB and 55 healthy donors were enrolled to evaluate the T-cell response to cocktail peptides (Rv3615c, ESAT-6 and CFP-10) and the Rv2351c protein. Responses against the cocktail peptides and the Rv2351c protein were obtained through the T-SPOT.TB assay. The dots represent the response in each case under stimulation with cocktail peptides and Rv2351c. The thick line represents the average response of each group. P was calculated by t-test to evaluate the statistically significant differences (*P<0.05; **P<0.001).
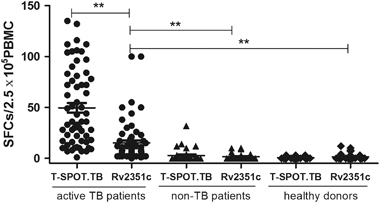
Table 3 Comparison of results using the bacteriological test results as ‘gold standard’ for TB diagnosis
Figure 3 Antibody response against Ag85B and Rv2351c in BALB/c mice immunized with Ag85B or Rv2351c conjugate in DDA/poly (I:C) adjuvant. Serum samples were analyzed for the presence of anti-Ag85B and anti-Rv2351c antibodies via ELISA. The isotype profile of the antibodies was characterized using conjugated secondary antibodies specific for IgG, IgG1 and IgG2a. The data are plotted as geometric mean±SD log10 end point titer. P was calculated by t-test to evaluate the statistically significant differences (*P<0.05; **P<0.001).
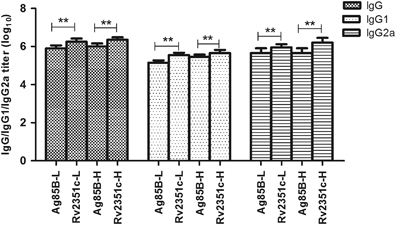
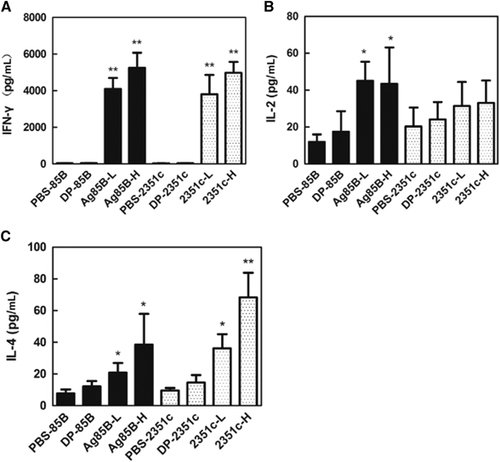
Figure 4 Evaluation of cytokine secretion by splenocytes from immunized mice, isolated and co-cultured with Ag85B or Rv2351c. The splenocytes were prepared four weeks after the mice were immunized with Ag85B or Rv2351c (three times, 2-week intervals). The splenocytes (1 × 10⁶) were then co-cultured with Ag85B (5 μg/mL) or Rv2351c (5 μg/mL) for 72 h before the levels of the cytokines (A) IFN-γ, (B) IL-2 and (C) IL-4 were measured in the culture supernatants using commercial ELISA kits. The data for cytokine secretion are presented as the mean±SD of two independent experiments. The level of statistical significance for differences between the negative control groups and the Ag85B or Rv2351c groups was determined using the t-test (*P<0.05; **P<0.001).