Figures & data
Figure 1 Seasonal variation in the detection rate of Coronavirus HKU15 in swine nasopharynx during January 2012–February 2014.
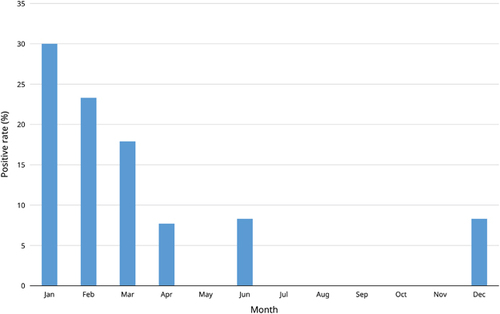
Figure 2 Resolution of sequence ambiguities by cloning. RT, reverse transcription; PCR, polymerase chain reaction. Numbers above nucleotides indicate the respective nucleotide positions with respect to the complete genome sequence of Coronavirus HKU15 strain S579N quasispecies 1 (International Nucleotide Sequence Databases LC216914). Six intra-strain quasispecies were found. Post-cloning plasmid-dependent PCR-sequencing confirmed that the presence of indels at positions 189 and 376 was not due to polymerase slippage. Quasispecies 1 and 3 were detected in both nested PCR using first round primers LPW18323/LPW30836 and second round primers LPW33264/LPW6975 as well as nested PCR using first round primers LPW33199/LPW33200 and second round primers LPW33264/LPW6975. However, quasispecies 2 and 4 were only detected in nested PCR using first round primers LPW33199/LPW33200 and second round primers LPW33264/LPW6975, whereas quasispecies 5 and 6 were only detected in nested PCR using first round primers LPW18323/LPW30836 and second round primers LPW33264/LPW6975.
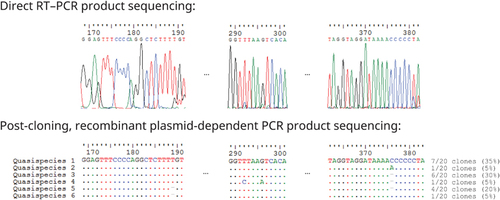
Figure 3 Phylogenetic tree showing the relationship of the two Coronavirus HKU15 nasopharyngeal strains to other Coronavirus HKU15 strains. The trees were inferred from the almost complete genome sequence data by the maximum likelihood method with the substitution model TN93 (Tamura–Nei model)+G (gamma-distributed rate variation)+I (estimated proportion of invariable sites). The scale bar indicates the estimated number of substitutions per base. Numbers at nodes (expressed in percentage) indicate the levels of bootstrap support calculated from 1 000 replicates, and values lower than 70 are not shown. The two nasopharyngeal strains sequenced in this study are highlighted in bold. All names and accession numbers are given as cited in the International Nucleotide Sequence Databases.
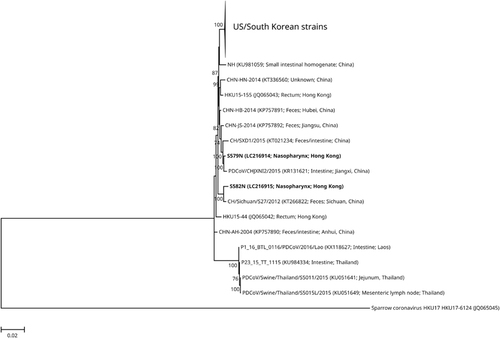
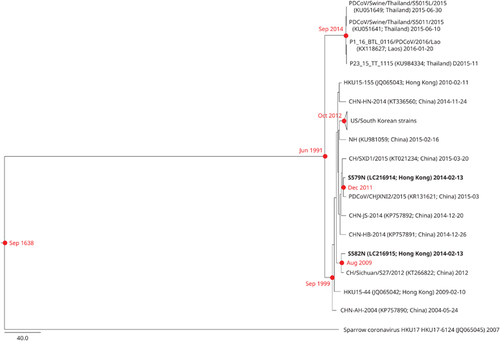
Figure 4 Estimation of tMRCA for Coronavirus HKU15. The timescaled phylogeny was inferred from complete Coronavirus HKU15 genomes. The two nasopharyngeal strains sequenced in this study are highlighted in bold. All names and accession numbers are given as cited in the International Nucleotide Sequence Databases.