
Figures & data
Figure 1 (A) Mean annual rainfall (mm) based on the TRMM satellite data and (B) mean (C) minimum and (D) maximum temperature (°C) based on the NCEP2 reanalysis data set. The annual mean is calculated for the 1998–2014 period. This figure was created using the National Centre for Atmospheric Research (NCAR) Command Language (NCL) version 6.1.2 (http://www.ncl.ucar.edu/).
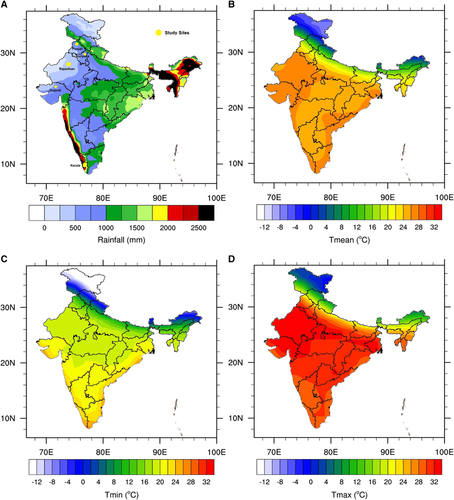
Table 1 Average dengue incidence rate (per million population) during 1998–2014 and average temperature (minimum and maximum) and rainfall calculated for the period 1961–1990 for five Indian states
Figure 2 Dengue incidence rates (per million population) in India from 1998 to 2014. (Data source: NVBDCP, Govt. of India).
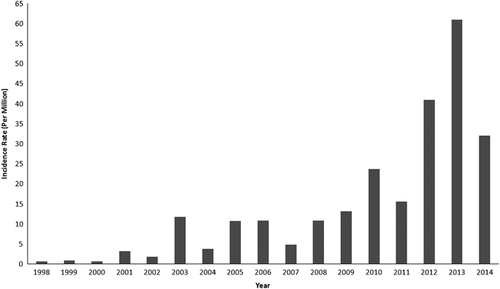
Figure 3 Average dengue incidence rates (per million population) by state in India from 1998 to 2014. The map was generated with ArcGIS-10.2.1 software (http://www.esri.in) from dengue case data.
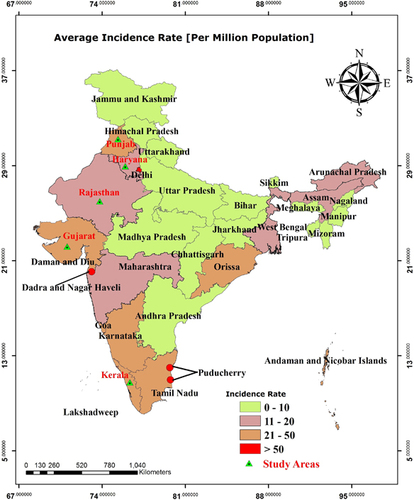
Figure 4 Yearly dengue incidence rates for different states of India. (Data source: NVBDCP, Govt. of India).
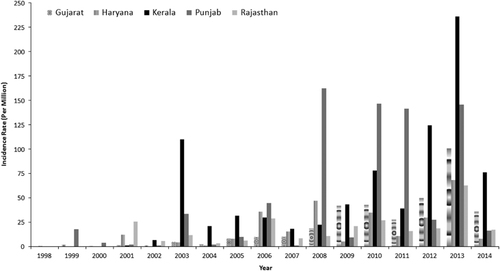
Figure 5 EIP (days) for DENV estimated from daily temperature data (from 1979 to 2014) for five states of India. The horizontal line (EIP=30 days) depicts a theoretical threshold, where EIP exceeds the maximum longevity of the mosquito vector.
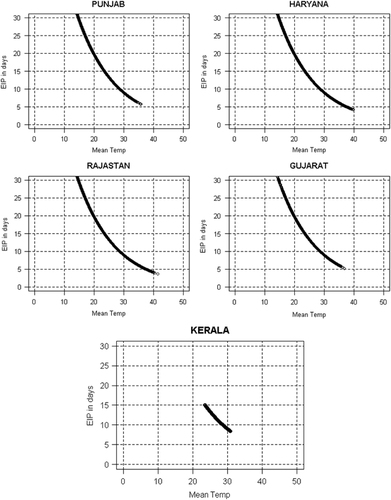
Figure 6 Mean annual EIP (in days) based on NCEP2 monthly mean temperatures calculated for the period 1998–2014. This figure was created using the NCAR Command Language (NCL) version 6.1.2 (http://www.ncl.ucar.edu/).
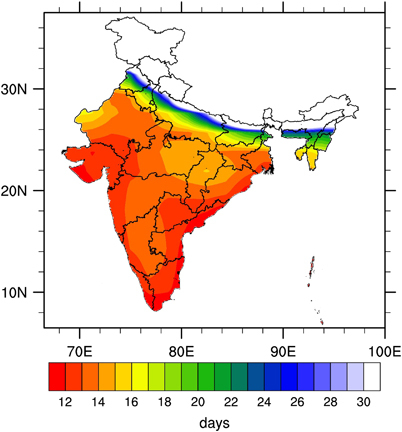
Table 2 EIP days range and mean EIP days with ±95% CI for different seasons predicted using daily temperature data for the period 1979–2014
Table 3 Pearson correlation analysis between annual dengue cases and annual rainfall