
Figures & data
Table 1 Sampled populations of Pseudorasbora parva and the distribution of Sphaerothecum destruens in P. parva using molecular detection across P. parva’s native and non-native range
Figure 1 Pseudorasbora parva sites screened in this study for Sphaerothecum destruens presence in the host’s native range (China) and invasive range (Europe, North Africa and Eurasia). The red sites were positive for S. destruens and the black sites were negative using the 18S rRNA marker. Europe- Austria, A; Bulgaria, BG; France, F; Hungary; H, Italy, IT; Spain, SP; Turkey, T; United Kingdom, UK. North Africa- M, Morocco; Eurasia- I, Iran; Asia- China (S1, S2, S3, S7, S9, S11, S12, S13, S14 and S16); Japan, JP.
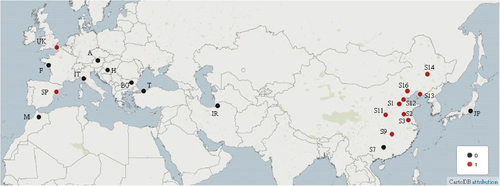
Figure 2 Minimum spanning network based on the 18S rRNA segment (397 bp) of Sphaerothecum destruens. The size of the different circles represents the frequency of each respective haplotype. The numbers on the branches indicate the number of mutations between the nodes. Black circles indicate branch splits. The color code indicates S. destruens individuals from different localities; Red: China (n=11), Yellow: Spain (n=1), Light blue: Turkey (n=1), Brown: UK (n=2) and Green: USA (n=3). Haplotypes H_1, H_2, H_3 and H_4 represent S. destruens 18S rRNA haplotypes. The Cyt-b P. parva haplotype for individuals positive for S. destruens (with S. destruens haplotypes H_3 and H_4) was Haplotype 6.
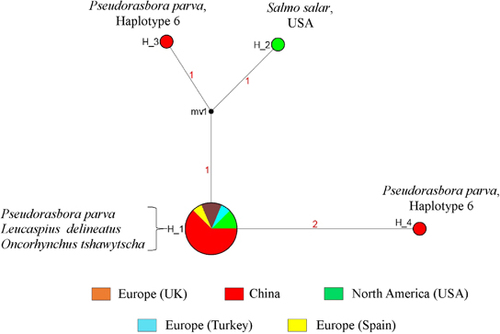
Figure 3 Unrooted phylogenetic tree resulting from Bayesian inference method in MrBayesCitation27 based on Hasegawa–Kishino–Yano modelCitation31 analysis of the ribosomal ITS 1 sequences of Sphaerothecum destruens. Isolate origins and GenBank accession numbers are RA 1–3 (FJ440707.1), RA 3-1 (FJ440708.1), RA 3-2 (FJ440709.1), RA 3-3 (FJ440710.1), RA 4-1 (FJ440702.1), RA 4-3 (FJ440703.1), RA 4-4 (FJ440704.1), RA-Turkey (KT361608.1) and RA-China (MF138119).
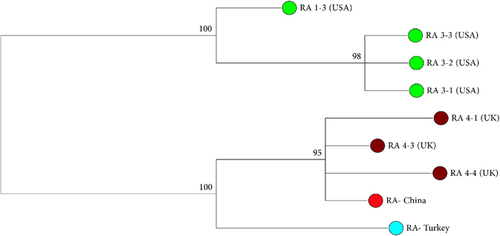
Figure 4 Molecular phylogenetic analysis of Cyt-b haplotypes of Pseudorasbora parva populations across its invasive and native range. The tree was inferred from the Bayesian inference method based on the Hasegawa–Kishino–Yano modelCitation31 with Gamma distribution in MrBayes.Citation27 The colored circles indicate the countries that each haplotype has been found in and the colored stars indicate S. destruens positive haplotypes in that country.
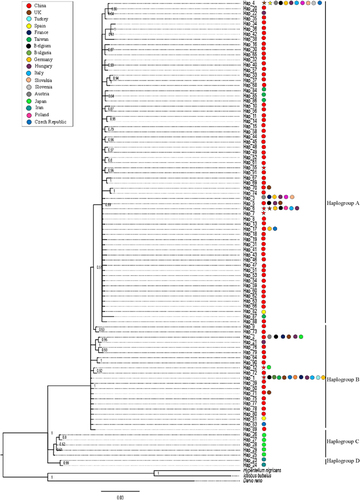
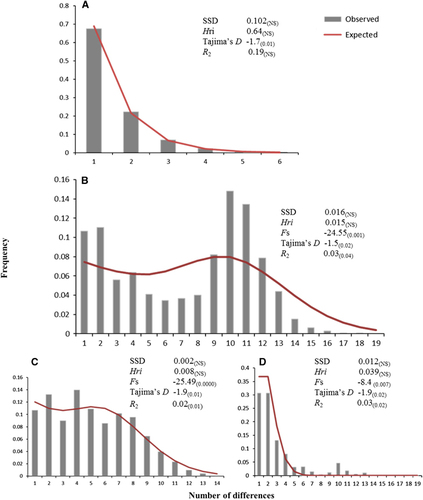
Figure 5 Frequency distributions of the number of pairwise nucleotide differences (mismatch) between (A) 18S rRNA haplotypes of Sphaerothecum destruens populations in China; (B) cytochrome b haplotypes of Pseudorasbora parva populations in China; (C) P. parva haplogroup A, and (D) P. parva haplogroup B. The solid line is the theoretical distribution under the hypothesis of population expansion. Sum of squared differences, Harpending’s raggedness index (Hri), Fu’s Fs, Tajima’s D and Ramos-Onsins and Rozas’ R2 statistics are listed next to each dataset. The P-values for each statistical test can be found in parentheses. Significance was set at a P-value of 0.05, except for Fs, for which it was set at 0.01.