
Figures & data
Figure 1 Heatmap of hepatitis C virus (HCV) subtype percentages in 29 provinces. This heatmap was generated using R3.2.1 software. The maximum method was used in clustering analysis.
Figure 2 Hepatitis C virus (HCV) subtype distribution of males and females. Minor—minor subtypes; Mixed—mixed infections. The number of male carriers was much greater than females in this study, and male carriers showed a higher level of diversity. The Simpson’s diversity index of male and female carriers was 0.6688 and 0.5892 (P=1.23E−234), respectively.
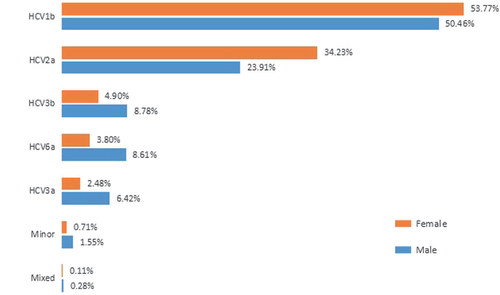
Table 1 HCV genotyping and viral load
Figure 3 Composition of HCV genotype 1, 2, 3, 6 in Mainland China. (A) The distribution of HCV 1 in Mainland China. (B) The distribution of HCV 2 in Mainland China. (C) The distribution of HCV 3 in Mainland China. (D) The distribution of HCV 6 in mainland China. Data for three provinces were not shown because of the lack of positive cases (Xinjiang, Tibet, Beijing).
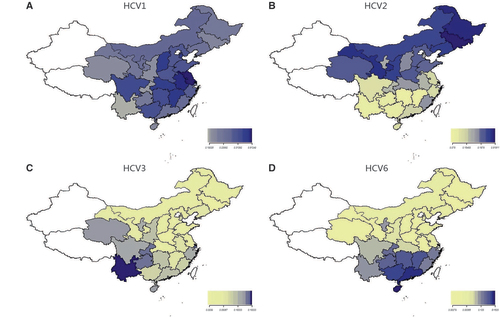
Table 2 Distribution of subtypes of HCV genotype 1, 2, and 3
Table 3 Distribution of HCV 6 subtypes