Figures & data
Table 1 Detection of viral strain compositions in standard mixtures
Figure 1 HBV nucleotide acid (nt1–3215) complexity values for C01, C02 and C03. The colored bars indicate the complexity of 5-bp nucleotides calculated by two methods for the full-length HBV genome (blue bars represent TGS and red bars represent CBS). Samples C01, C02 and C03 were presented from outer track to inner track, respectively. Theoretical values of each sample were indicated with black lines. clone-based sequencing, CBS; hepatitis B virus, HBV; third-generation sequencing, TGS.
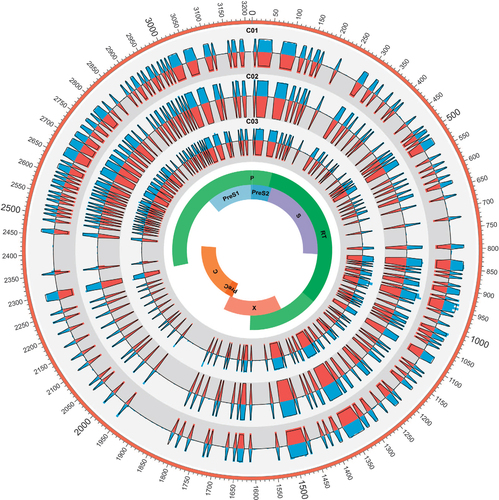
Figure 2 QS complexity at nucleotide level (A) and amino-acid level (B); genetic distance at nucleotide level (C) and amino-acid level (D); dS (E) and dN (F) of C, P, S and X ORFs based on CBS and TGS data. Line above the box indicated the maximum, upper line of the box indicated the 75th percentile, line in the box indicated the median value, lower line of the box indicated the 25th percentile and line below the box indicated the minimum. Points in red represent the characteristics of QS derived from CBS, and points in blue represent the characteristics of QS derived from TGS. clone-based sequencing, CBS; open reading frame, ORF; quasispecies, QS; third-generation sequencing, TGS.
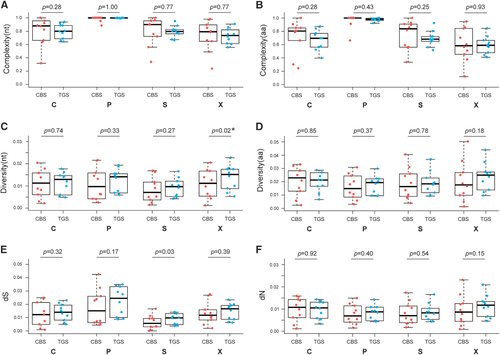
Table 2 Number of mutations detected by TGS and CBS
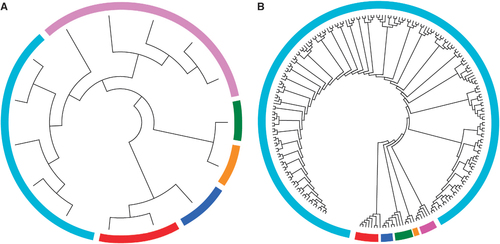
Figure 3 Phylogenetic trees were generated from the full-length HBV genome in patient S08 by CBS (A) and TGS (B). Strains within different clusters were marked with different colors. clone-based sequencing, CBS; hepatitis B virus, HBV; third-generation sequencing, TGS.