
Figures & data
Table 1 MERS-CoV-positive camel samples March–April 2015
Figure 1 Phylogeny of MERS-CoV full genomes or near-full genomes from humans and dromedary camels. (A) The number of samples sequenced in this study that fell into each lineage. Yellow, lineage 2; green, lineage 3; orange, lineage 5; blue, lineage 6; and purple, lineage 7. (B) Maximum likelihood phylogenetic analysis of 126 complete and 3 nearly complete camel MERS-CoV genomes and 111 previously published human and camel MERS-CoV genomes. Red closed circles, camel samples sequenced in this study. Red open circles, camel samples previously sequenced from UAE by our lab. Green closed circles, human samples previously sequenced by our lab. Camel samples are denoted with a camel symbol. * indicate genomes that are nearly complete. Yellow shading indicates the German MERS-CoV case linked to the market in this study. Light blue shading indicates closely related sequences from camels that were housed in the same pen. Bootstrap values are shown next to the branches. The scale bar indicates the number of nucleotide substitutions per site. Middle East respiratory syndrome coronavirus, MERS-CoV.
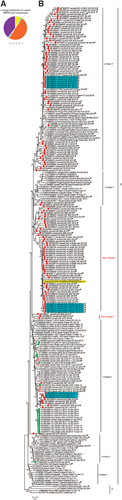
Figure 2 Analysis of camels sampled multiple weeks. (A) Schematic representation of camels housed together. Camel numbers are listed below each camel. Orange camels, camels with lineage 5 virus in week 3; blue camels, camels with lineage 7 virus in week 3; black camels, camels that we were unable to obtain a full-genome sequence from in week 3. (B–I) Nucleotide changes in camels sampled multiple times. x axis, week sampled and camel sampled; y axis, number of nucleotide changes compared to previous week sampled. Number of changes are relative to the previous genome sequenced for each camel. * represents camel sample pairs that changed lineages between the weeks compared. (B) Camel 414377 MF598702/MF598713 (week 3/4). (C) Camel 414492 MF598708/MF598712 (week 3/4). (D) Camel 414485 MF598699/MF598709 (week 3/4). (E) Camel 414500 MF598704/MF598714 (week 3/4). (F) Camel 415911 MF598706/MF598719 (week 3/4). (G) Camel 414486 MF598705/MF598716 (week 3/4). (H) Camel 415915 MF598707/MF598718/MF598722 (week 3/4/6). (I) Camel 416452 MF598715/MF598720/MF598721 (week 4/5/6).
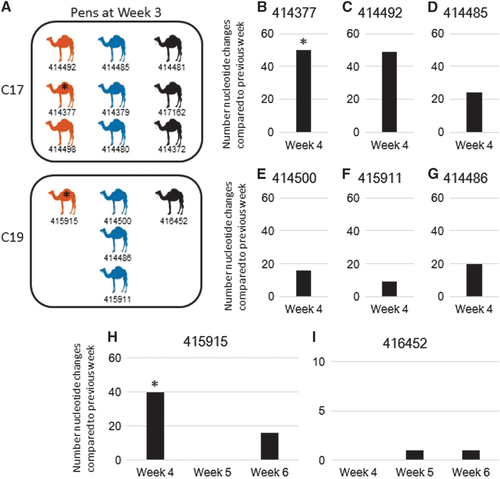
Figure 3 Characterization of recombination breakpoints and parental types. Each panel shows the similarity plot of a single recombination event. The different colored lines represent the similarity comparisons of the recombinant to its two potential parental strains from different lineages: orange, lineage 5; blue, lineage 7; and purple, lineage 2. The gray dotted line marks the potential location of recombination breakpoints.
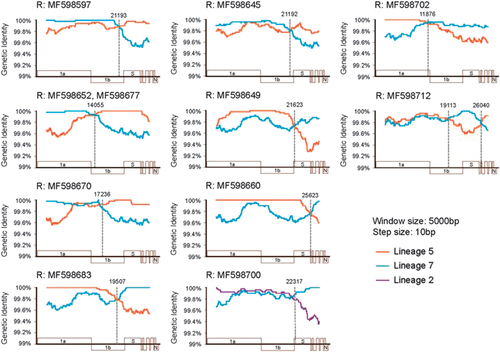
Table 2 Details of recombination events
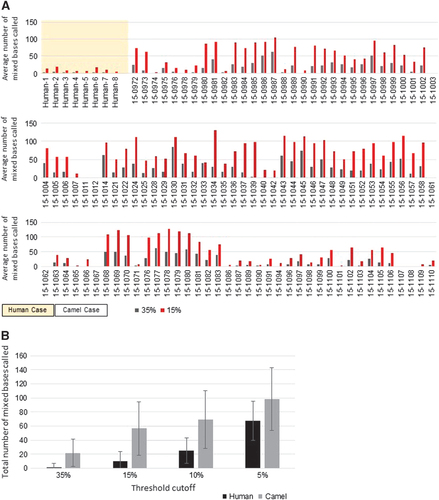
Figure 4 Minor variant analysis. (A) Average number of mixed bases called in human and camel MERS-CoV genomes. Gray bars, 35% threshold cutoff; red bars, 15% threshold cutoff. (B) Total number of mixed bases called at varying threshold levels between humans (black) and camels (gray). Middle East respiratory syndrome coronavirus, MERS-CoV.