
Figures & data
Figure 1 Schematic representation of the experimental design.
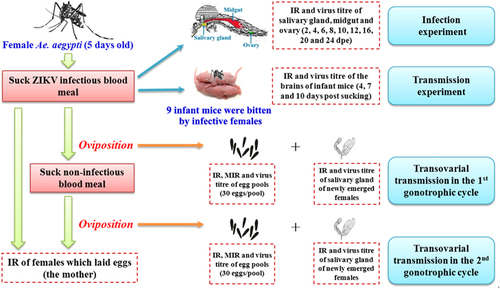
Figure 2 ZIKV infection rates of midguts (A), salivary glands (B) and ovaries (C) in two Ae. aegypti strains at different dpe to the blood meal. Eleven to fourteen mosquitoes were sampled per day. Error bars represent confidence intervals (95%).
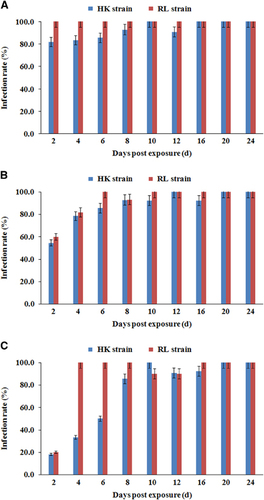
Figure 3 Quantification of Zika viral RNA copies by real-time PCR with reverse transcription detected in midguts (A), salivary glands (B) and ovaries (C) of two Ae. aegypti strains at different dpe. Error bars represent sd.
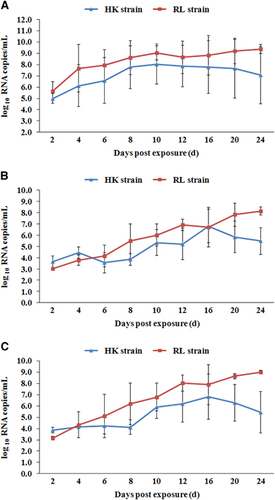
Table 1 Positive percentages and viral titers in the brains of infant mice bitten by infectious mosquitoes
Table 2 IR, MIR and viral titers of oviposited females, eggs and newly emerged females in the first gonotrophic cycle of infectious Ae.aegypti
Table 3 IR, MIR and viral titers of oviposited females, eggs and newly emerged females in the second gonotrophic cycle of infectious Ae.aegypti