
Figures & data
Figure 1 Phylogenetic analysis of H9N2 avian influenza viruses isolated from different hosts in China from 1994 to 2013. (A) Phylogenetic tree of the HA gene. (B) Phylogenetic tree of the NS gene. Phylogenetic trees of all eight segments with detailed virus information are depicted in Supplementary Figure S1. A summary of information for each clade is listed in Supplementary Table S1. Posterior values are shown for selected clades. Node branch colors indicate specific clades. Vertical black lines with numbers indicate the clade designated in this study, and vertical gray lines with gray words indicate the previous clade classification.
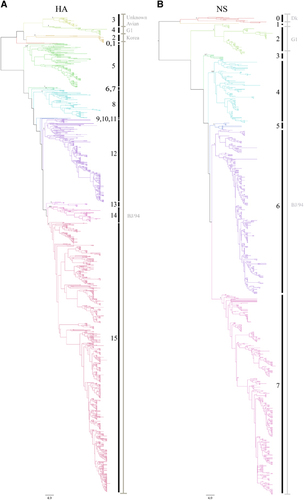
Table 1 Comparison of clade classifications in the current and previous studiesTable Footnotea
Figure 2 Genotypic prevalence and host distribution of H9N2 avian influenza viruses in China from 1994 to 2013. Virus particles are represented by ovals. The eight gene segments are indicated by horizontal bars within the ovals (from top to bottom: PB2, PB1, PA, HA, NP, NA, M and NS). The color of bars represents a distinct phylogenetic clade. Only the major genotypes that were detected for more than 2 years are represented. All detected genotypes (including major and transient genotypes) are provided in Supplementary Dataset S1. Pie charts indicate the host distribution of major genotypes in corresponding years, and each color represents a host species. Gray-shaded columns represent the three notable periods of H9N2 evolution: 1994 to 1999, 2000 to 2005 and 2006 to 2013.
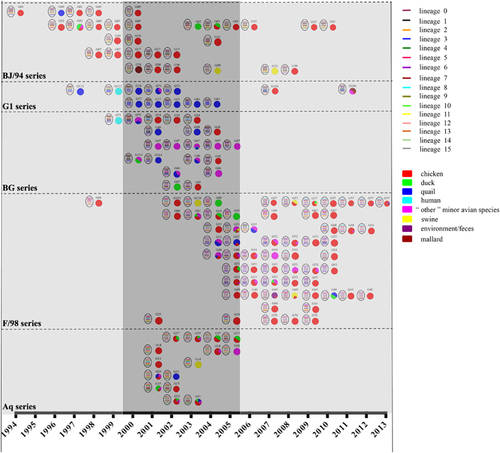
Figure 3 Genotypic diversity of H9N2 avian influenza viruses in China from 1994 to 2013. Top panel: light and dark gray-shaded areas depict distinct periods of H9N2 evolution. The predominant genotypic series of H9N2 viruses are displayed for each corresponding shade. Purple circles indicate three important time points. Bottom panel: the ‘genotype eruption’ in 2000; the ‘sudden decrease’ in 2006; and the ‘selection and subsequent predominance’ of G57 after 2010.
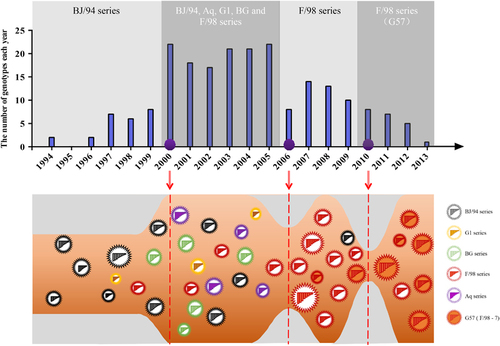
Figure 4 Geographic distribution of H9N2 influenza viruses in China from 1994 to 2013. (A) The number of H9N2-positive provinces in China. The primary circulation area in each period is indicated. (B) The prevalence of isolates and genotypes in their corresponding provinces for each period. The proportion of the isolates (or genotypes) from each province relative to the total number of isolates in all H9N2-positive provinces was calculated. Red dots represent the proportion of provinces in the Pearl River Delta region; blue dots represent the proportion of provinces in the eastern coastal region, and gray dots represent the proportion of all other provinces. (C) Map of the Pearl River Delta and eastern coastal regions in China.
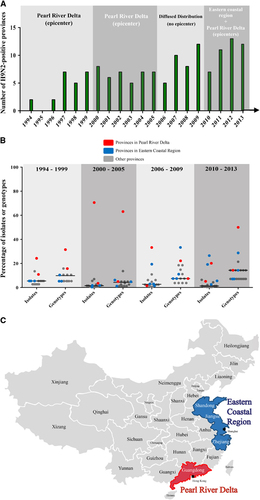
Figure 5 Prevalence in hosts and interspecies transmission of the major genotypes of H9N2 avian influenza viruses. (A) The proportion of host distribution of the G1 and BG or F/98 series of H9N2 viruses. (B) The prevalence of the G1 and BG (orange bars), F/98 (black bars) or other (gray bars) series of H9N2 viruses in China from 1994 to 2013. The G1 and BG series primarily circulated in quail and other minor poultry. The F/98 series primarily circulated in chickens. (C) Interspecies transmission of the major genotypes of H9N2 viruses. The histogram depicts the total number of major genotypes generated (gray bars) and the major genotypes exported to different hosts (black bars). The interspecies transmission ability of the major genotypes from each host is illustrated in pie charts. For example, in chickens, 16 genotypes were exported to other hosts, and 11 of these transmitted to only one different host (pink), three transmitted to two different hosts (red), one transmitted to three different hosts (dark red) and one transmitted to four different hosts (maroon).
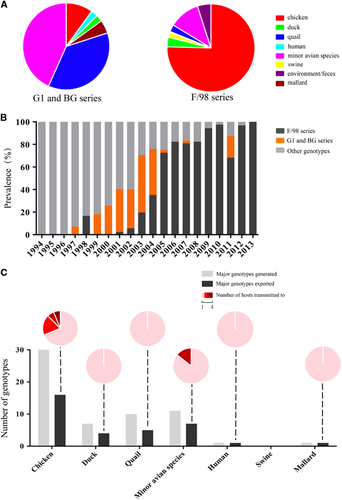
Figure 6 Ecology of H9N2 avian influenza viruses in China from 1994 to 2013. A representative diagram illustrates the interspecies transmission events of the major genotypes of H9N2 viruses. The major genotypes generated in each host are displayed in ovals within each host pictures. Solid lines represent confirmed gene flow directions. Dashed lines indicate indirect evidence of gene flow.
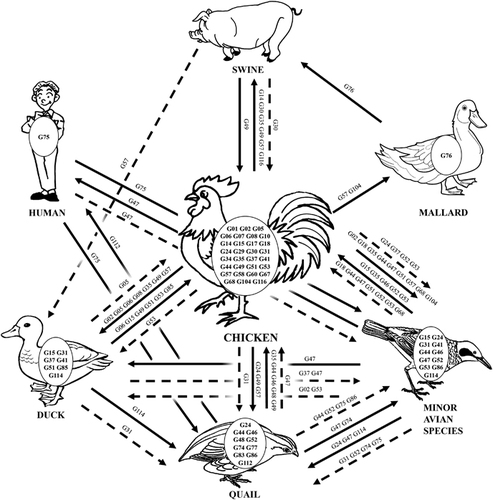
Table 2 Reassortment with specific segments change the host range of H9N2 influenza virus