Figures & data
Table 1 MIC/MEC ranges, modal of MICs/MECs, distribution of MICs/MECs (mg/L) obtained by testing the susceptibility of 159 A. fumigatus isolates to 10 antifungal agents and the percentage of non-WT isolates for the 159 isolates of A. fumigatus
Table 2 Comparisons of activities of eight antifungal drugs tested against A. fumigatus isolates in four geographic areas
Table 3 MICs/MECs of seven triazole-resistant A. fumigatus isolates and their corresponding mutation type in the cyp51A gene region and geographical origin
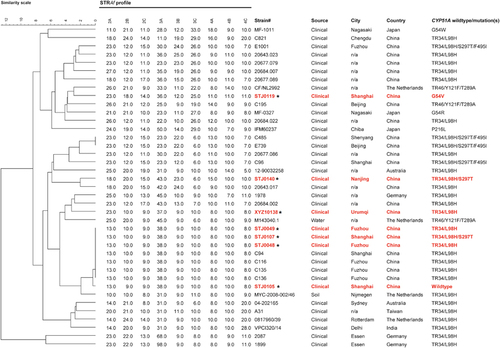
Figure 1 Genotypic analysis of triazole-resistant Aspergillus fumigatus clinical isolates, including seven triazole-resistant isolates in this study, and analyses published previously from China and other countries. The dendrogram is based on a categorical analysis of nine microsatellite markers in combination with the unweighted Pair Group Method with arithmetic mean clustering. The scale bar indicates the percentage identity. *Denotes the seven clinical Chinese isolates in this study.