Figures & data
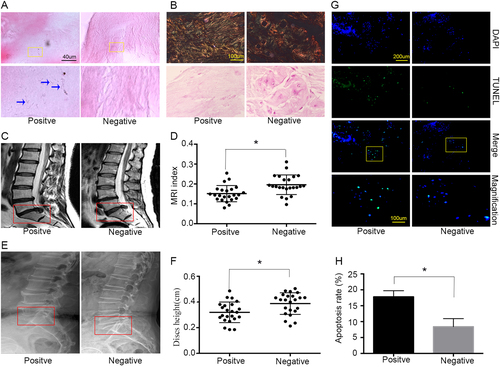
a H&E staining revealed rod-shaped bacteria growing in clusters in human disc tissues (indicated by blue arrows). b The severity of degeneration in the annulus fibrosus and nucleus pulposus was evaluated by Picrosirius Red and Safranin-O staining, respectively. c–f Representative images from MRI (c) and lateral X-ray (e) indicated severe degeneration in P. acnes-positive IVDs (n = 23 for each group). g, h More apoptotic NPCs were found in P. acnes-positive IVDs by TUNEL staining (n = 9 for each group). *P < 0.05, P values were analyzed using Student’s t test
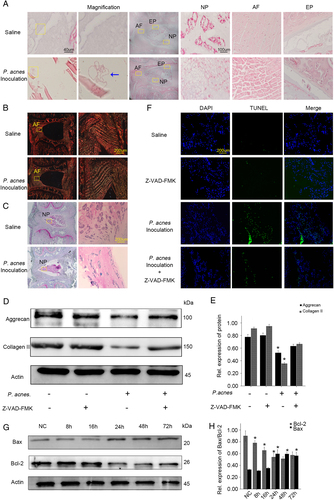
a H&E staining revealed the presence of inoculated P. acnes inside caudal IVDs, along with serpentine and disorganized fibers in the annulus fibrosus, fewer cells and a reduced ECM in the nucleus pulposus as well as damage in endplates after inoculation for 72 h. b, c Picrosirius Red staining (b) and Safranin-O staining (c) suggested a decrease in collagen I fibers and glycosaminoglycans in P. acnes-inoculated IVDs. d Death of NPCs detected by TUNEL staining in IVDs infected with P. acnes treated with or without Z-VAD-FMK for 72 h. e, f Time-dependent expression of Bax and Bcl-2 induced by P. acnes. *The different infection groups compared with the NC group. g, h Western blot analysis of aggrecan and Collagen II in IVDs induced by P. acnes treated with or without Z-VAD-FMK for 72 h. *The infection groups compared with the infection+Z-VAD-FMK group. *P < 0.05, P values were analyzed by one-way ANOVA. Data are presented as the mean ± SD from three independent experiments (four rats per group, three discs per rat). NP nucleus pulposus, AF annulus fibrosus, EP endplate, Z-VAD-FMK caspase inhibitor
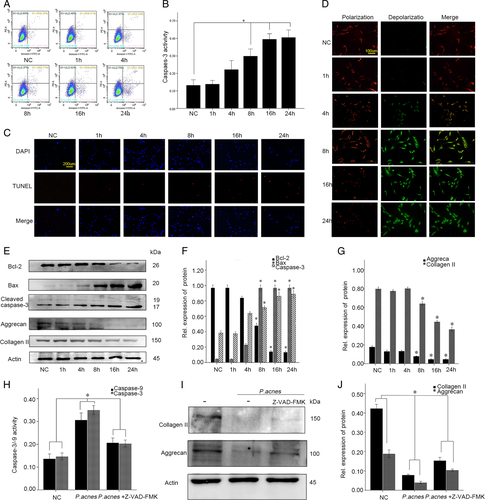
a–c Apoptotic rates of NPCs detected by flow cytometry (a), caspase-3 activity (b), and TUNEL staining (c) in NPCs after incubation with P. acnes for different periods at a MOI = 100:1. d Immunofluorescence analysis of JC-1 in NP cells in response to P. acnes infection at a MOI = 100:1. e–g Time curve expression of Bax, Bcl-2, cleaved caspase-3, aggrecan, and collagen II in NPCs induced by P. acnes at a MOI = 100:1. *The different infection groups compared with the NC group. h–j Western blot analysis of aggrecan and Collagen II. NPCs were treated with or without Z-VAD-FMK (20 µM) pre-incubation for 1 h and then infected with P. acnes for 24 h. *P < 0.05, P values were analyzed by one-way ANOVA. Data are presented as the mean ± SD from three independent experiments. NC negative control, Z-VAD-FMK caspase inhibitor
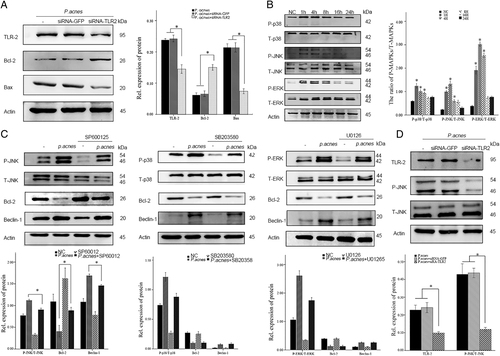
a Western blot analysis of TLR2, Bcl-2 and Bax. NPCs were per-transfected with or without Tlr2-siRNA for 16 h and then infected with P. acnes for 8 h. b Western blot analysis of MAPKs (ERK, JNK, p-38) in NPCs induced by P. acnes for different time periods. *The different infection groups compared with the NC group. c Western blot analysis of MAPKs (ERK, JNK, p-38) and Bcl-2/beclin-1. NPCs were per-incubated for 2 h with or without MAPKs specific inhibitors (SP600125 20 µM, SB203580 10 µM, U0126 20 µM) in the presence or absence of P. acnes for 1 h (for ERK, JNK, p-38) and 24 h (for Bcl-2/Beclin-1). d Western blot analysis of TLR2, P-JNK, and T-JNK. NPCs were per-transfected with or without Tlr2-siRNA for 16 h and then infected with P. acnes for 1 h. *P < 0.05, P values were analyzed by one-way ANOVA. Data are presented as the mean ± SD from three independent experiments
a Immunofluorescence analysis of LC3 in NPCs induced by P. acnes at a MOI = 100:1 for different time periods. *The different infection group compared with the NC group. b Electron microscopy images of autophagy. NPCs infected with P. acnes at a MOI 100 were examined at 8 h post-infection. Intracellular P. acnes were surrounded by a variety of membrane structures (indicated by a yellow arrow), and extracellular P. acnes are indicated by a red arrow. c Western blots of p62 and LC3 in P. acnes-positive and negative nucleus pulposus (n = 9 for each group). *Positive sample vs. negative sample. d Western blots of p62 and LC3 in NPCs induced by P. acnes at s MOI = 100:1 for different time periods. *The different infection groups vs. the NC group. e Western blots of p62 and LC3 in rat IVDs after infection with P. acnes for different time periods. (n = 4 rats per group, three discs per rat). * The different infection groups vs. the NC group. f Western blot analysis of the phosphorylation of mTOR and the expression of TLR2/Class III PI3K in NPCs after 1 h of P. acnes infection (MOI = 100:1). *P. acnes group vs. negative control group. g Western blot analysis of LC3 and cleaved caspase-3 in NPCs induced by P. acnes at a MOI = 100:1 for 8 h pretreated with 3-MA (5 mM) or rapamycin (500 μM) for 2 h. *P. acnes group vs. the P. acnes + 3MA/Rapa group. h Western blot analysis of Beclin-1, LC3, and cleaved caspase-3. NPCs were pre-transfected with or without Beclin-1-siRNA for 16 h = and then infected with P. acnes for 8 h. *The P. acnes + siRNA-Beclin-1 group vs. the P. acnes or P. acnes + siRNA-GFP group. *P < 0.05, P values were analyzed by one-way ANOVA. Data are presented as the mean ± SD from three independent experiments
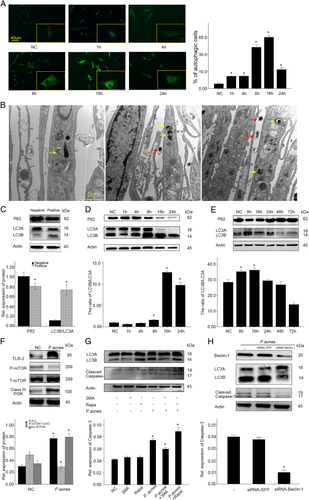
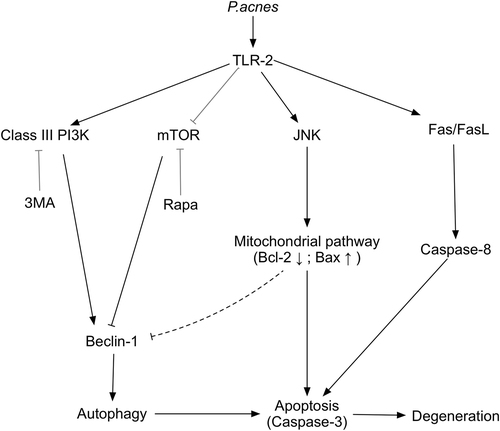
Fig. 6 Schematic illustration of P. acnes-induced IVDD by promoting apoptosis and autophagy