Figures & data
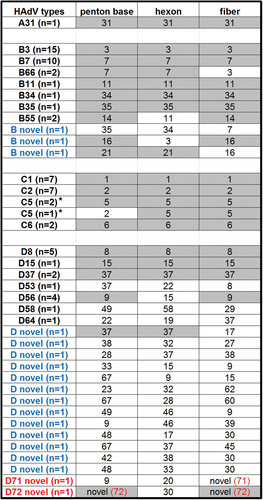
Inventory of HAdV isolates
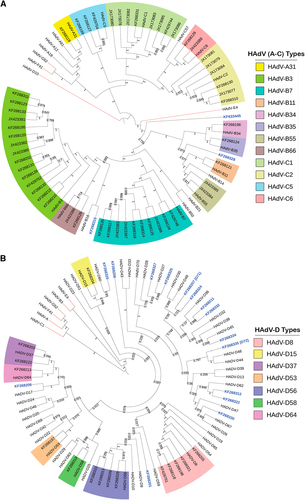
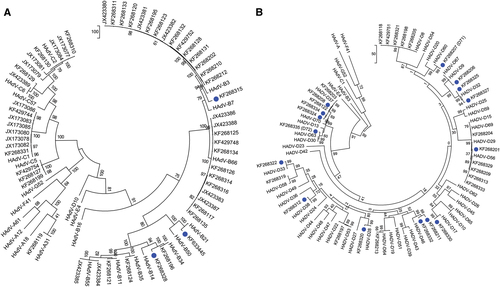
Two trees are presented in order to display the larger number of species D clearly. Representatives of species E, F, and G are presented for reference. Trees were constructed using the maximum-parsimony analysis, following alignment using the ClustalW tool in the Molecular Evolutionary Genetic Analysis version 6 software package (MEGA6; www.megasoftware.net/), with a bootstrap test of 1000 replicates and default parameters and Tree-Bisection-Reconnection (TBR) method. Each clade is highlighted according to specific HAdV species using a color code as shown. Novel sequences are shown in blue and displayed as GenBank accession numbers (acc. nos.). Bootstrap values are displayed on the branches and nodes for different HAdV species used for references are shown in red
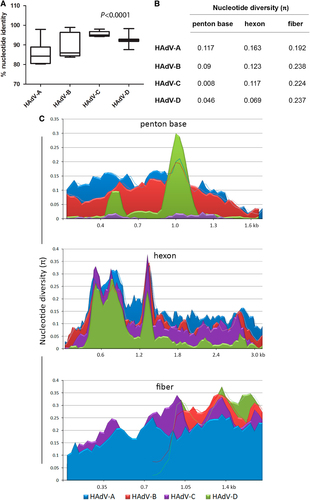
a “Box-and-whiskers” plots show percent nucleotide identity of prototype HAdV complete genome sequences. The “box” represents the median and interquartile range (IQR), and the “whiskers” show both minimum and maximum values. The spacing between the boxes indicates the degree of spread; as depicted, the HAdV-C and D species are relatively homogenous. The nucleotide identities are significantly different for HAdV species analyzed (Kruskal–Wallis, P < 0.0001). b Average nucleotide diversity of the major capsid genes between each type within HAdV-A through D. c Nucleotide diversity (π) plots showing the average number of nucleotide differences per site along each gene for HAdV-A through D, calculated for penton base, hexon, and fiber prototype sequences. The plot was constructed using DnaSP v5 ((http://www.ub.edu/dnasp/), with a 100 nucleotide window and 25 nucleotide step size. Nucleotide alignments with gaps were excluded and graphs were constructed using Microsoft Excel software. The lines in the graph represent “trend lines”. Viruses within HADV-B and -D had shorter fiber genes than HAdV-A or -C and the trend lines are denoted accordingly
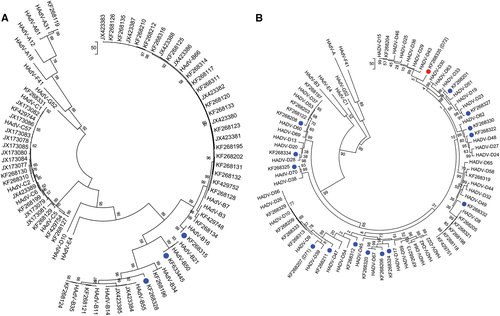
Penton base gene sequences of a HAdV species A–C genotypes and b HAdV species D genotypes are presented; two trees allow for discrimination of the larger numbers of species D genotypes. Representatives of species E, F, and G are included for reference. Sequences obtained from this study are displayed as GenBank accession numbers. Novel HAdVs in this data set, identified by whole-genome analysis, are marked with blue dots. A novel penton base gene (KF268355; HAdV-D72) that diverged significantly from previously described HAdV-D sequences is identified by a red dot. Trees were constructed using the maximum-parsimony analysis, following alignment using the ClustalW tool in the Molecular Evolutionary Genetic Analysis v6 software package (MEGA6;www.megasoftware.net/), with a bootstrap test of 1000 replicates and default parameters, and Tree-Bisection-Reconnection (TBR) method in MEGA 6.0
a SimPlot analysis demonstrates the genetic distances to HAdV reference sequences across the penton base gene, in which the x-axis denotes gene nucleotide position and the percentages of permutated trees that supported grouping are marked along the y-axis (http://sray.med.som.jhmi.edu/SCRoftware/simplot/). b Bootscan analysis demonstrates phylogenetic relationships to the reference strains. Each HAdV reference genotype is color coded; only closely related HAdV types are presented for clarity. Penton base gene recombination between hypervariable region (HVR)-1 and the RGD motif-containing HVR-2 is shown. The HVR-1 fragment showed high similarity with HAdV-D37, while HVR-2 was dissimilar to existing reference sequences, indicating both recombination and a novel gene segment. Prior to recombination analysis, sequences were aligned using the ClustalW tool in the Molecular Evolutionary Genetic Analysis v6 software package (MEGA6; www.megasoftware.net/). Default parameter settings for the Simplot software were used for analyzing the hexon sequences: window size (200 nucleotides [nt]), step size (20 nt), replicates used (n1/4100), gap stripping (on), distance model (Kimura) and tree model (neighbor-joining). c Homology modeling of the penton base in which the HAdV-D72 amino-acid sequences (blue) is superimposed over that of HAdV-D37 (cyan). Superimposition of structural models showed significant structural variation in RGD motif location (indicated in red). Homology model was built in Swiss ExPASy (http://swissmodel.expasy.org) using the crystal structure of HAdV-C2 as the template ([PDB] code 1X9TA)
![Fig. 4 Recombination and structural modeling analysis of putative novel penton base gene in HAdV-D72a SimPlot analysis demonstrates the genetic distances to HAdV reference sequences across the penton base gene, in which the x-axis denotes gene nucleotide position and the percentages of permutated trees that supported grouping are marked along the y-axis (http://sray.med.som.jhmi.edu/SCRoftware/simplot/). b Bootscan analysis demonstrates phylogenetic relationships to the reference strains. Each HAdV reference genotype is color coded; only closely related HAdV types are presented for clarity. Penton base gene recombination between hypervariable region (HVR)-1 and the RGD motif-containing HVR-2 is shown. The HVR-1 fragment showed high similarity with HAdV-D37, while HVR-2 was dissimilar to existing reference sequences, indicating both recombination and a novel gene segment. Prior to recombination analysis, sequences were aligned using the ClustalW tool in the Molecular Evolutionary Genetic Analysis v6 software package (MEGA6; www.megasoftware.net/). Default parameter settings for the Simplot software were used for analyzing the hexon sequences: window size (200 nucleotides [nt]), step size (20 nt), replicates used (n1/4100), gap stripping (on), distance model (Kimura) and tree model (neighbor-joining). c Homology modeling of the penton base in which the HAdV-D72 amino-acid sequences (blue) is superimposed over that of HAdV-D37 (cyan). Superimposition of structural models showed significant structural variation in RGD motif location (indicated in red). Homology model was built in Swiss ExPASy (http://swissmodel.expasy.org) using the crystal structure of HAdV-C2 as the template ([PDB] code 1X9TA)](/cms/asset/06973544-5507-4858-b9e4-a8b0ad8bc632/temi_a_12039911_f0004_ob.jpg)
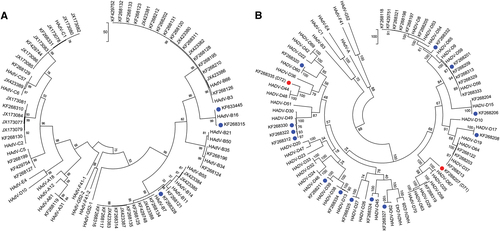
Gene sequences of hexons from a HAdV-A, -B, and -C and b HAdV-D are presented. Trees were constructed, following sequence alignment with ClustalW, using the maximum-parsimony option of the Molecular Evolutionary Genetic Analysis v6 software package (MEGA6; www.megasoftware.net/) and implementing a bootstrap test of 1000 replicates and default parameters. Sequences derived from this large-scale sequencing study are identified by their GenBank accession codes. Putative novel genotypes are denoted by blue dots. No novel hexon sequence was found
Sequences of a HAdV-A, -B, and -C and b HAdV-D are presented as phylogenetic trees. Sequences derived from this large-scale sequencing study are identified by their GenBank accession codes. Novel HAdV genotype sequences identified by whole-genome analysis are denoted with blue dots. Novel fiber genes (KF268207, HAdV-D71, and KF268355, D72) with sequences that diverged significantly with known HAdV-D type sequences are identified by red dots. Trees were constructed, following sequence alignment with ClustalW, using the maximum-parsimony option of the Molecular Evolutionary Genetic Analysis v6 software package (MEGA6; www.megasoftware.net/) and implementing a bootstrap test of 1000 replicates and default parameters
For each isolate sequenced and providing whole-genome sequence, their capsid genes are noted, with the number of related isolates in parenthesis as “n = ”. Capsid genes that were shared within each HAdV type are highlighted. HAdV genotypes that are novel recombinants are indicated in blue and HAdV types containing novel genes indicated in red; novel genotype number is indicated in red and in parenthesis. *The penton bases for HAdV-C species are highly conserved and, therefore, these penton base genes did not contribute to HAdV typing in this species by whole-genome analysis