Figures & data
Fig. 1 Number of patients by year—our series
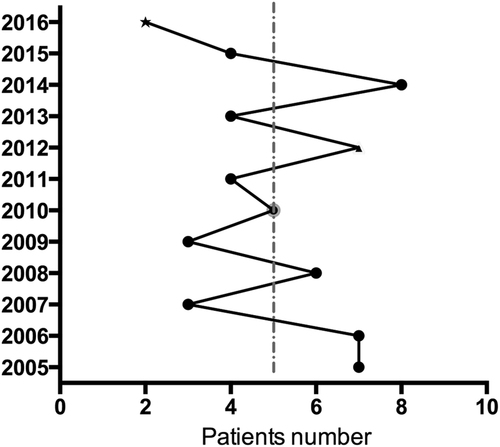
Fig. 2 Publication timeline and reporting department from the literature review. a Number of publications by year. b Distribution of the reporting department. ENT ear-nose-throat; OMFS oral and maxillofacial surgery
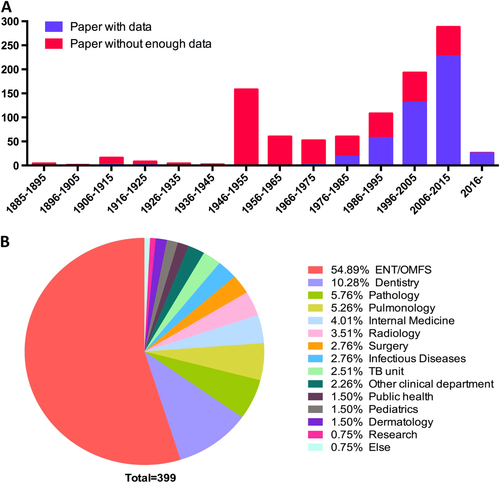
Fig. 3 Geographical distribution of HNTB patients from the literature review
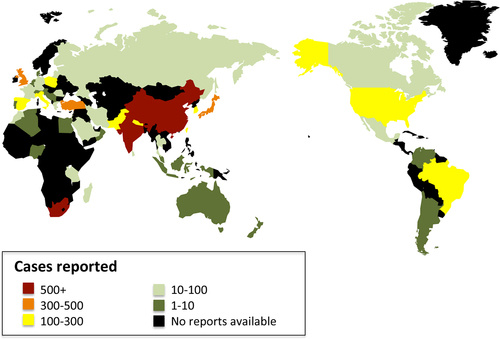
Fig. 4 Annual prevalence of HNTB by continent from the literature review
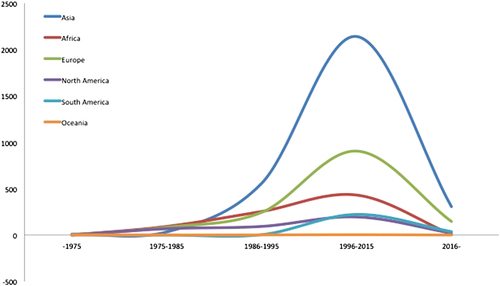
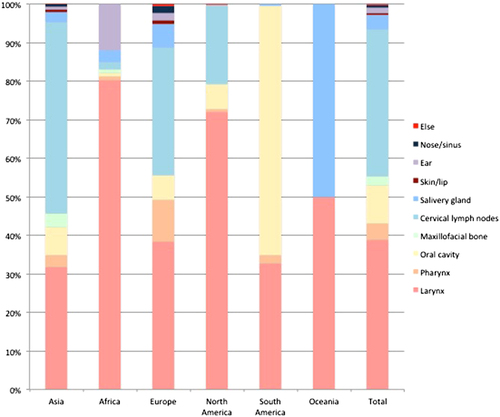
Fig. 5 Organ distribution of HNTB by continent from the literature review
Reports of patient with concurrent HNTB and tumor
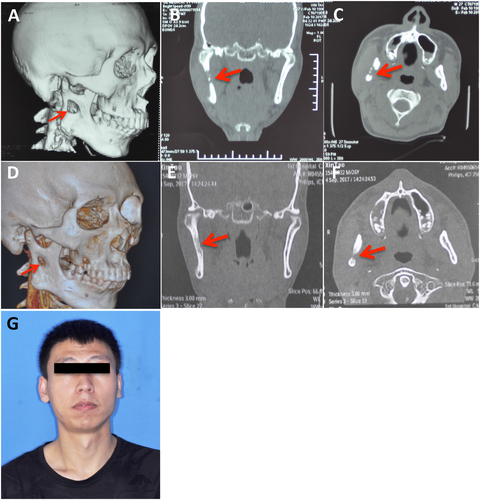
Fig. 6 Clinical material of a HNTB patient—the case report.a Frontal photograph. b–d Computed tomography results. e Panoramic tomography results. f Liquid aspirate from the lesion site. White arrows: HNTB lesion; Red arrow: mandibular involvement
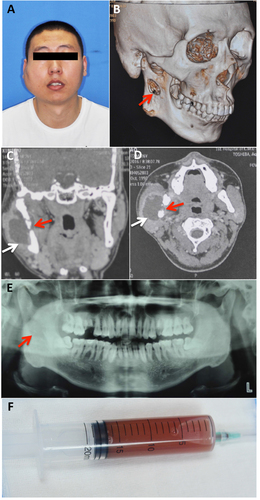
Fig. 7 Follow-up material of the HNTB patient—the case report. a–c Computed tomography results after two months of treatment. d–f Computed tomography results after ten months of treatment. g Frontal photograph after ten months of treatment. Red arrow: mandibular involvement