Figures & data
Alimentary samples tested in the present study
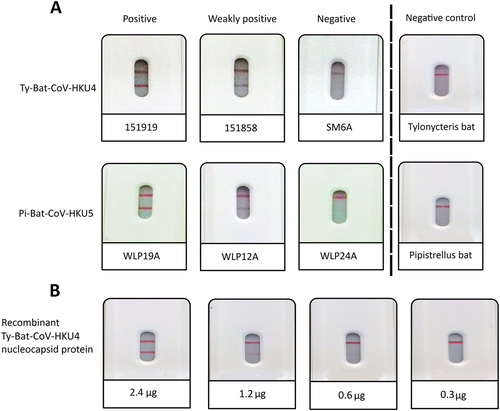
a positive, weakly positive and negative results for selected Ty-BatCoV-HKU4 positive and Pi-BatCoV-HKU5 positive samples and negative results for Tylonycteris pachypus and Pipistrellus abramus CoV RNA-negative samples; and (b) results for serial dilutions of recombinant nucleocapsid protein of Ty-BatCoV-HKU4 strain SM2A
Rapid test results and viral loads of Ty-BatCoV-HKU4 and Pi-BatCoV-HKU5 positive samples
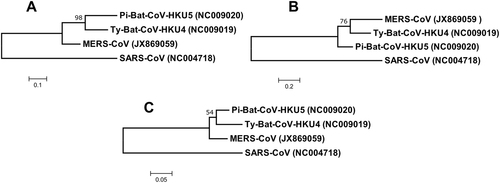
Fig. 2 Phylogenetic analysis of (a) nucleocapsid, (b) spike and (c) RdRp protein of Ty-BatCoV-HKU4, Pi-BatCoV-HKU5, and MERS-CoV. The trees were constructed by maximum-likelihood method in MEGA 6 using substitution model WAG+G (nucleocapsid), WAG+F+I+G (spike) and LG+G (RdRp) with SARS-CoV as the outgroup. The percentage of trees in which the associated taxa clustered together next to the branches with bootstrap values was calculated from 1000 trees. The scale bars indicate the number of substitutions per 10, 5, and 20 amino acids, respectively
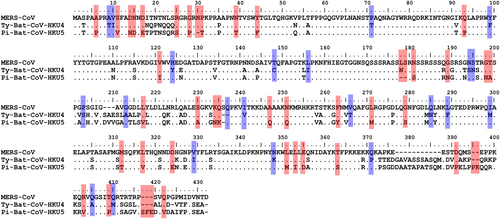
Red color shows the amino acid residues that were identical between the nucleocapsid proteins of MERS-CoV and Ty-BatCoV-HKU4 but not with that of Pi-BatCoV-HKU5. Blue color shows the amino acid residues that were identical between nucleocapsid proteins of MERS-CoV and Pi-BatCoV-HKU5 but not with that of Ty-BatCoV-HKU4