
Figures & data
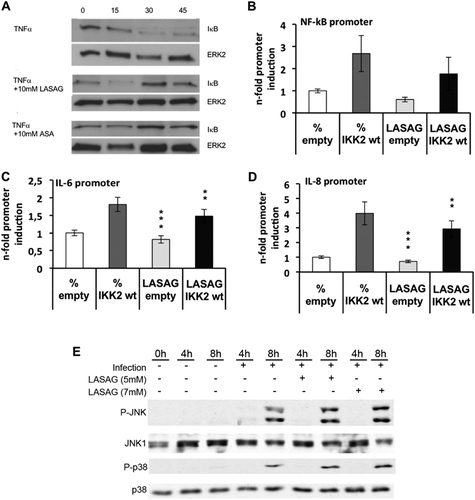
a Activation of the NF-κB signaling pathway in A549 cells via TNF-α leads to degradation of IκB. IκB degradation and a NF-κB activation are inhibited after treatment of A549 cells with either 10 mM LASAG (BAY 81–8781) or 10 mM ASA. ERK2 represents the loading control. b, c, d LASAG inhibits IKK-mediated transcriptional activation of NF-κB-dependent promoters. A549 cells were transfected with plasmids carrying a NF-κB-specific promoter element in front of a luciferase gene b or the promoter constructs of NF-κB-dependent genes IL-6 C and IL-8 d. Cells were co-transfected with either empty vector or a plasmid expressing a wt form of IKK2 that is active upon overexpression. At 16 h post-transfection, cells were treated with solvent or 5 mM LASAG for an additional 6 h. Cells were then lysed and promoter activity was determined by measuring luciferase activity. The results show the mean of three independent experiments. P < 0.05 = *; P < 0.01 = **; P < 0.005 = ***. e LASAG does not have non-specific effects on virus-induced activity of mitogen-activated protein kinases (MAPK) JNK and p38. A549 lung epithelial cells were either left uninfected (lanes 1–3) or were infected with IAV A/FPV/Bratislava/79 (H7N7) (MOI = 5) for 4 or 8 h, respectively (lanes 4–9). Infected cells were either left untreated (lane 1–5) or treated with either 5 mM (lanes 6 and 7) or 7 mM LASAG (lanes 8 and 9) immediately after infection. Cells were then lysed, and protein lysates were separated by PAGE and blotted onto nitrocellulose membranes. Membranes were then incubated with antibodies against phosphorylated active forms of MAPKs JNK and p38. Pan-JNK1 and p38 blots served as loading controls
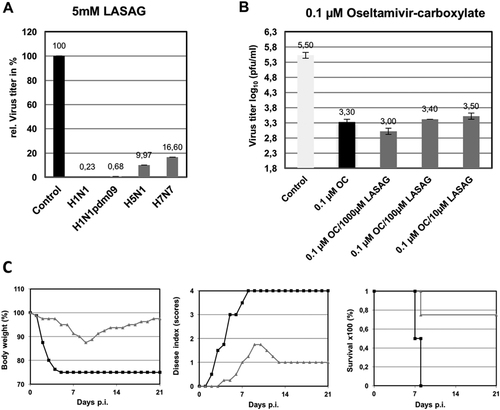
a A549 cells were infected with A/Puerto Rico/8/1934 (H1N1) (MOI: 0.01; A/Regensburg/D6/2009 (H1N1pdm09) (MOI: 0.001), A/Mallard/Bavaria/1/2006 (H5N1) (MOI: 0.001), or A/FPV/Bratislava/79 (H7N7) (MOI: 0.001). At 30 min after infection, cells were treated with 5 mM LASAG, and 24 h later, virus titers were determined from the supernatants. The results are presented as percent virus titers relative to infection without LASAG treatment. b A549 cells were infected with A/Mallard/Bavaria/1/2006 (H5N1) (MOI: 0.001). At 30 min after infection, cells were treated with either 0.1 µM oseltamivir carboxylate (OC) alone or in combination with either 1000 µM, 100 µM, or 10 µM LASAG. Twenty-four hours later, virus titers were determined from the supernatants. The results are presented as virus titers in log10 pfu/ml. c Eight-week-old C57BL/6 mice (four per group) were anesthetized with ketamine/rompun and infected with 1.5 × 10⁵ PFU (5 × MLD50) of the influenza virus strain A/FPV/Bratislava/79 (H7N7). Starting 1 h prior to infection, mice received twice-daily treatment with 10% LASAG (gray lines) or solvent (black lines) via inhalation for five days. Bodyweight and clinical symptoms were monitored daily over an observation period of 21 days
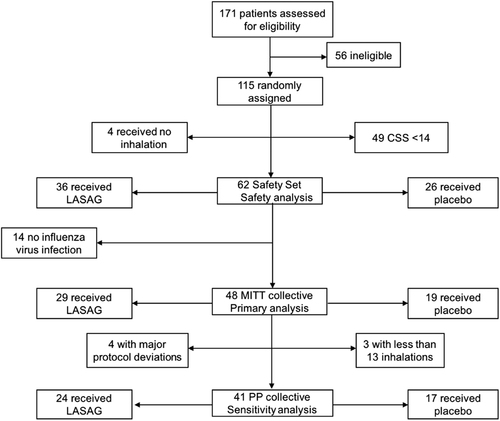
Breakdown of patient allocation to different populations
Baseline characteristics of the modified intention to treat population
Influenza symptoms of the MITT population at baseline/screening
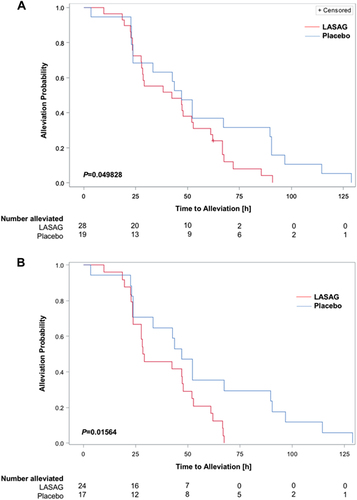
Time to alleviation of influenza symptoms and time to alleviation of clinical signs (alleviated patients)
a The MITT subset consisted of patients with RT-PCR-confirmed influenza and CSS ≥ 14. As censoring occurred within the population, Kaplan–Meier estimates and the log rank test were used for primary hypothesis testing. The P-value obtained with the log-rank test was P = 0.049828 (in favor of LASAG) b Per protocol analysis of patients with RT-PCR confirmed influenza and CSS ≥ 14. The difference was statistically significant based on a log rank test with P = 0.01564 (in favor of LASAG)
Presence of influenza virus specific RNA