Figures & data
Whole-cell ELISA of B. pertussis virulence factors
Characteristics of strains used in this study
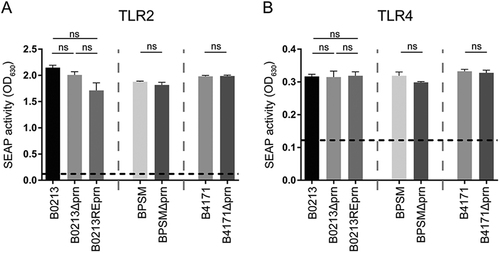
The different strains used in this study, B0213, B0213Δprn, B0213REprn, BPSM, BPSMΔprn, B4171, and B4171Δprn (MOI of 40), were used to stimulate HEK-Blue cells either expressing a TLR2 or b TLR4. Activation of these receptors is indicated as SEAP activity. Medium stimulation is indicated by the dotted line. Ns non-significant
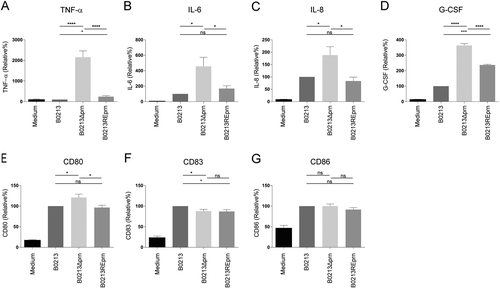
MoDCs were stimulated with B0213, B0213Δprn or B0213REprn at an MOI of 10 or left unstimulated for 48 h. Using luminex, moDC production of a IL-6, b TNF-α, c IL-8, and d G-CSF in the supernatant and surface expression, using flow cytometry, of e CD80, f CD83, and g CD86 was determined. Experiments were performed using at least three donors *P ≤ 0.05, **P ≤ 0.01, ***P ≤ 0.001, ****P ≤ 0.0001
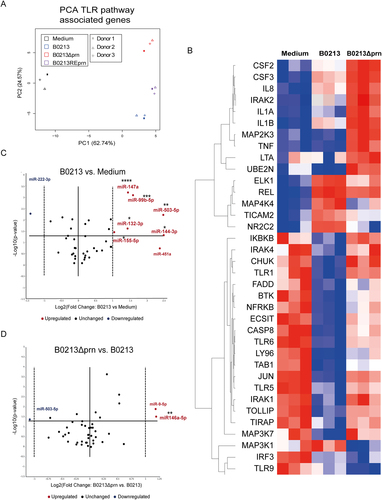
RNA was isolated 6 h post infection and gene expression of 84 different TLR-pathway associated genes was analysed by means of a a PCA. Moreover, b the heatmap shows the hierarchical clustering (Pearson’s correlation) of relative expression levels for differentially expressed genes between medium, B0213, and B0213Δprn stimulated moDC. Relative expression levels for each individual gene are presented as minimum (blue) and maximum (red). Rows represent gene expression profiles of individual samples, 6 h after stimulation. For all samples and all genes included in the TLR-qPCR array. The expression of various microRNAs by moDCs was determined comparing c parental strain B0213- with medium-stimulated moDCs as well as d B0213Δprn- with B0213-stimulated moDCs. Experiments were performed using at least three donors. * P ≤ 0.05, **P ≤ 0.01, *** P ≤ 0.001, ****P ≤ 0.0001
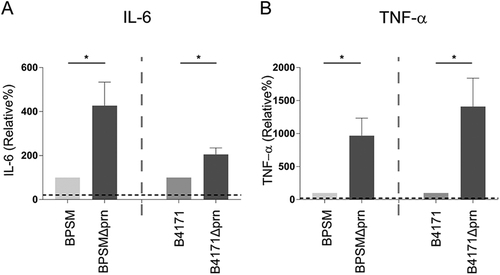
MoDCs were stimulated with BPSM, BPSMΔprn, B4171 or B4171Δprn at an MOI of 10 or left unstimulated for 48 h. MoDC production of a IL-6 and b TNF-α was determined in the supernatant. Experiments were performed using at least three donors *P ≤ 0.05
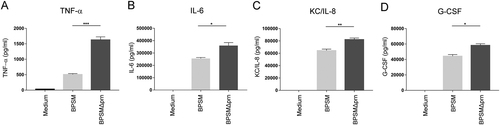
Murine BMDCs were stimulated with BPSM or BPSMΔprn at an MOI of 100 or left unstimulated for 48 h. BMDC production of a TNF-α, b IL-6, c KC/IL-8, and d G-CSF in the supernatant was determined. Experiments were performed using murine BMDCs from four mice per experimental condition *P ≤ 0.05, **P ≤ 0.01, ***P ≤ 0.001
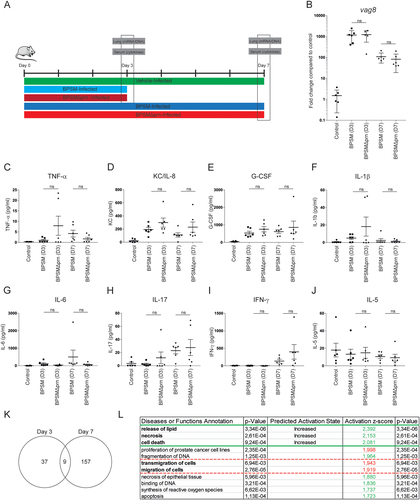
a Balb/c mice were infected with 106 CFU of the parental BPSM, BPSMΔprn or left uninfected as control. Serum for cytokine analysis and lungs for RNA sequencing were collected on day 3 and day 7 post infection. Bacterial DNA load in the lungs was determined using a b qPCR on the Bordetella-specific target gene vag8 relative to the murine household gene ptger2. In serum of BPSM-, BPSMΔprn-infected and control mice, the presence of c TNF-α, d IL-6, e G-CSF, f IL-17, g KC/IL-8, h IL-1β, i IFN-γ, and j IL-5 was determined on both time points post-infection. k Venn diagram showing the amount of differentially expressed genes on day 3 and 7 in the lungs of mice infected with BPSMΔprn, as compared to BPSM infected mice, based on averaged normalized gene expression levels of groups. RNA sequence data on day 7 was analysed using the l diseases or function annotation tool of the software programme Ingenuity from Qiagen. The animal experiment was performed using six mice per infection group per time point and six control uninfected mice. *P ≤ 0.05, **P ≤ 0.01, ***P ≤ 0.001