Figures & data
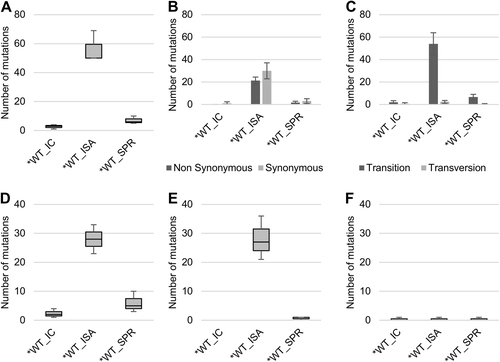
To investigate the impact of reverse genetics on viral population heterogeneity, the complete genome sequence of each virus was determined in triplicate. a Represents the number of mutations detected. Mutation characteristics are represented in b (Nonsynonymous/Synonymous mutations) and c (Transition/Transversion). d–f Represent the number of low-, mid- and high-frequency mutations, respectively. In a, d–f, the bottom and top of the box represent the first and third quartiles, the band inside the box represents the median value and the ends of the error bars represent the minimum and maximum values. In b, c, the average number of mutations is shown, and the error bars represent the standard deviation
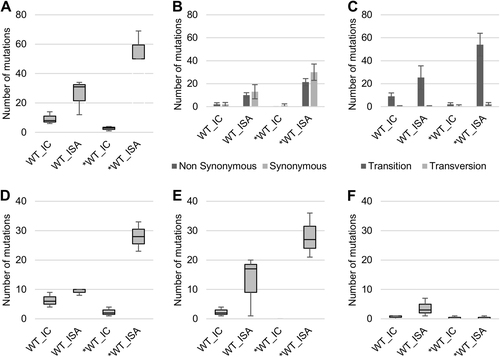
Fig. 2 Impact of the ISA method on replicative fitness. Viral loads in cell supernatant media, after one passage in Vero ATCC cells, were estimated using a real-time RT-PCR assay (molecular viral loads, a and a TCID50 assay (infectious titers), b. We then performed competition experiments c, d: WT and *WT viruses were mixed together to infect Vero ATCC cells. Cell supernatant media were passaged 10 times. The relative proportion of each virus was evaluated by sequencing a genomic fragment encompassing the differentiating position 4420. In a, b, the bottom and top of the box represent the first and third quartiles, the band inside the box represents the median value and error bars represent the minimum and maximum values. In c, d, the error bars represent the standard deviation
Evolution of cell supernatant infectious virus titers (TCID50 assay) during passage in Vero ATCC cells (a). b, c represent the number of mutations detected at the first and fourth passage, respectively. In a, the average number of TCID50/ml is shown, and error bars represent the standard deviation. In b, c, the bottom and top of the box represent the first and third quartiles, the band inside the box represents the median value, and the error bars represent the minimum and maximum values
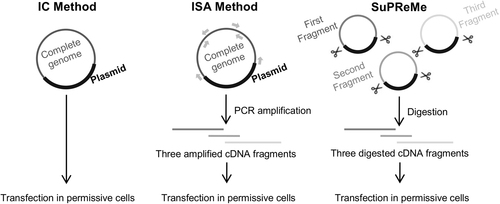
The SuPReMe comprises the following steps: -Cloning subgenomic overlapping DNA fragments flanked by two unique restriction sites. -Digesting each cloned subgenomic overlapping DNA fragments by restriction enzymes. -Preparing an equimolar mix of digested subgenomic overlapping DNA fragments. -Using that mix for cell transfection
To investigate the impact of the reverse genetics method on the genetic heterogeneity of the viral populations, the complete genome sequence of each virus was established in triplicate. a represents the number of mutations detected. Mutation characteristics are represented in b (nonsynonymous/synonymous mutations) and c (transition/transversion). d–f represent the number of low-, mid- and high-frequency mutations, respectively. In a, d–f, the bottom and top of the box are the first and third quartiles, the band inside the box represents the median value and error bars represent the minimum and maximum values. In b, c, the average number of mutations is shown, and error bars represent the standard deviation
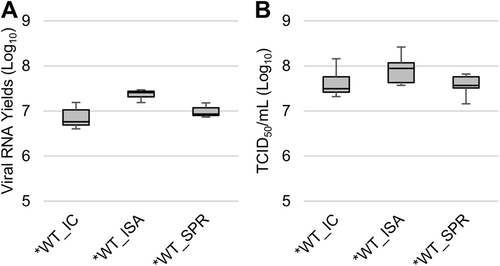
Cell supernatant media after one passage on Vero ATCC cells were used to measure viral loads using a real-time RT-PCR assay (molecular viral loads, a) and a TCID50 assay (infectious titers, b). The bottom and top of the box represent the first and third quartiles, the band inside the box represents the median value, and error bars represent the minimum and maximum values