Figures & data
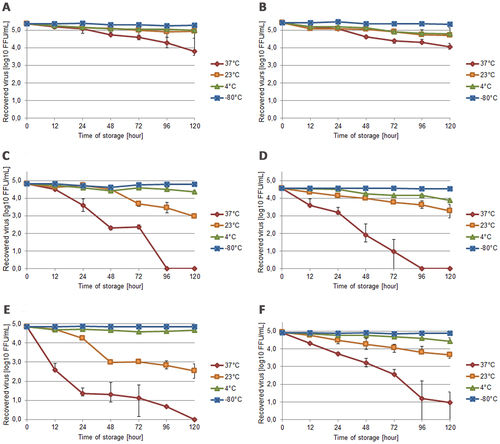
a EDTA-whole blood, b plasma, c simulated capillary blood, d urine, e semen and f RPMI-cell culture media (control) at different temperatures. The data points represent the mean values calculated from the average log10 FFU/mL reduction in each of the volunteers (error bars show SD values). Each sample was titrated in triplicate
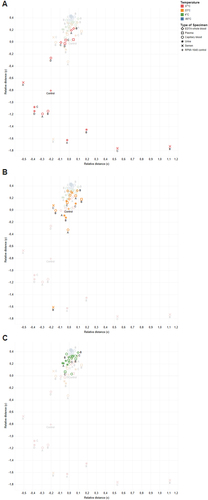
a 37 °C, b 23 °C and c 4 °C. Data points are classified by color in the figures for different storage temperatures (as indicated). Different types of specimens are represented by different marker shapes (as indicated), and the four donors are indicated by letters