Figures & data
Total number of norovirus genotypes identified in Australia and NZ from July 2014 to December 2016
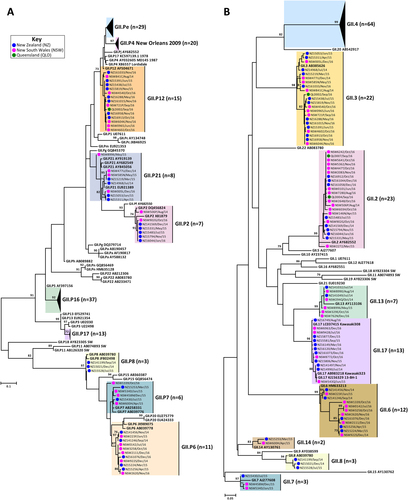
Representative norovirus GII strains isolated in clinical samples (n = 149/686) were analysed phylogenetically. Strains analysed are denoted with a bullet (•) and colour-coded to show sample origin (pink = NSW, blue = NZ and green = QLD). Sample names contain the geographical location and time of collection. Reference strains were downloaded from GenBank and labelled with their genotype and accession number. a Phylogenetic analysis of 172 bp of the 3′-end of the polymerase gene of norovirus GII viruses. b Phylogenetic analysis of 282 bp from the 5′-end of the capsid gene of norovirus GII viruses. The scale bar indicates the number of nucleotide substitutions per site. Sequence alignments were performed using the MUSCLE algorithm. Maximum likelihood phylogenetic trees were produced with MEGA 7 softwareCitation59 and bootstrap tests (1000 replicates) based on the Kimura two-parameter modelCitation60. The bootstrap percentage values are shown at each branch point for values ≥ 70%
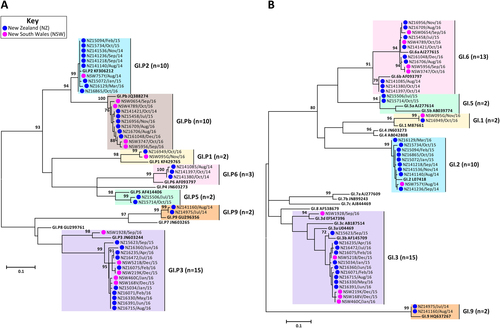
Representative norovirus GI strains isolated in clinical samples (n = 52/83) are shown in this phylogenetic analysis. Strains analysed in this study are denoted with a bullet (•) and colour-coded to show sample origin (pink = NSW and blue = NZ). All sample names contain the geographical location and time of collection. Reference strains were downloaded from GenBank and labelled with their genotype and accession number. a Phylogenetic analysis of 172 bp of the 3′-end of the polymerase gene of norovirus GI viruses. b Phylogenetic analysis of 223 bp of the 5′-end of the capsid gene of norovirus GI viruses. The scale bar indicates the number of nucleotide substitutions per site. Sequence alignments were performed using the MUSCLE algorithm. Maximum likelihood phylogenetic trees were produced with MEGA 7 softwareCitation59 and bootstrap tests (1000 replicates) based on the Kimura two-parameter modelCitation60. The bootstrap percentage values are shown at each branch point for values ≥ 70%
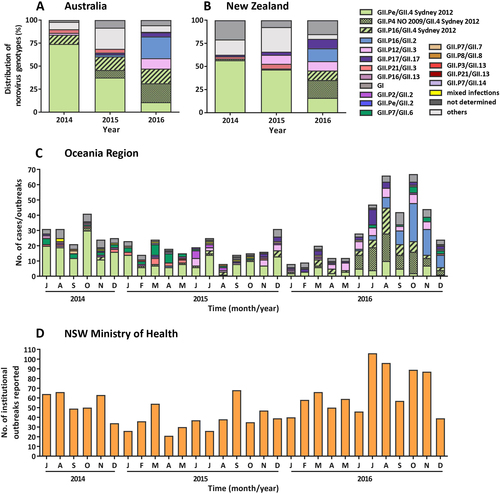
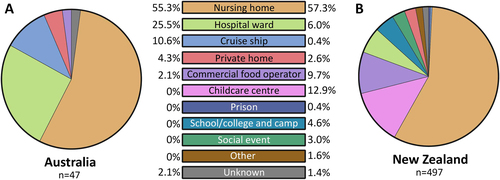
a The prevalence of norovirus genotypes identified in Australia during the study period. A total of 238 individual norovirus cases and 47 outbreaks were sequenced and genotyped from Australia (NSW, ACT and QLD). b All samples collected, sequenced and genotyped from New Zealand represented viruses from 497 separate outbreaks. Samples with unknown capsid genotypes and mixed GI/GII infections were excluded in this analysis (n = 14). c The monthly norovirus genotypic distribution for Australia and New Zealand combined throughout the study period (2014–2016) was examined. Different genotypes and GII.4 variants are colour-coded as per the legends. All norovirus GI viruses identified are grouped together under GI (dark grey) and others include all GII viruses identified (GII.P2/GII.2, GII.Pe/GII.2, GII.P7/GII.6, GII.P7/GII.7, GII.P16/GII.13 and GII.P21/GII.13) that are not indicated in the legends. d The monthly number of institutional outbreaks reported to the NSW Ministry of Health, Australia
Full-length genome sequences of novel noroviruses viruses identified in this study and their reported outbreak dates
The setting for norovirus outbreaks was compared between Australia and New Zealand during the study period. A total of 47 and 497 outbreaks were identified in Australia and New Zealand, respectively. An outbreak is defined as two or more cases linked by location and time
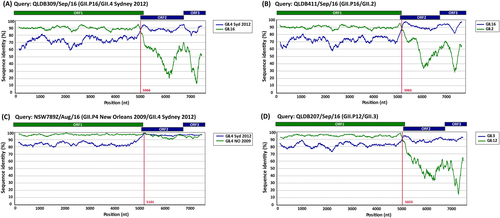
Representative sequences of emerging viruses were subjected to full-length genome sequencing and analysed using Simplot for the identification of recombination breakpoints. For all recombinant strains, a single breakpoint was identified at the ORF1/ORF2 overlap region. a Simplot for recombinant strain GII.P16/GII.4 Sydney 2012 (QLDB309/Sep/16, GenBank accession number KY905335) with a breakpoint identified at nucleotide position 5066. b Simplot for recombinant strain GII.P16/GII.2 (QLD411/Sep/16, GenBank accession number KY905336) with a breakpoint identified at nucleotide position 5062. c Simplot for recombinant GII.P4 New Orleans 2009/GII.4 Sydney 2012 (NSW789Z/Aug/16 (GenBank accession number KY905331) with a single breakpoint identified at nucleotide position 5101. d Simplot for recombinant GII.P12/GII.3 (QLDB207/Sep/16, GenBank accession number KY905334) with a breakpoint at nucleotide position was 5023. The breakpoint positions are shown by red lines. Each analysis used a window size of 300 nt and a step size of 5 nt. The reference strains used are as follows: GII.4 Syd 2012 for NSW0514/2012/AU (GenBank accession number JX459908), GII.4 NO 2009 for NSW001P/2008/AU (GenBank accession number GQ845367), GII.3 for HK71/1978/CHN (GenBank accession number JX846924), GII.12 for 04-179/2005/JP (GenBank accession number AB220922), GII.16 for Neustrelitz260/2000/DE (GenBank accession number AY772730) and GII.2 for KL109/1978/MYS (GenBank accession number JX846925)
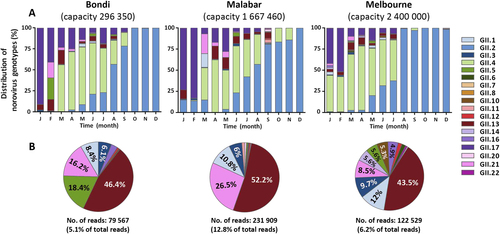
Norovirus genotypic distribution was determined in waste water samples by capsid amplicon sequencing using next-generation sequencing (NGS) technology. Samples were sequenced on the MiSeq platform and Geneious was used for merging and mapping of the reads to the reference sequences. Capsid genotypes are labelled in different colours as indicated by the legends. a The genotype distribution of norovirus capsids identified in two waste water treatment plants in Sydney (Bondi and Malabar) and one in Melbourne, Australia. The Y-axis represents the percentage norovirus distribution in each sample and the time is indicated on the X-axis. b To further investigate the less predominant capsid genotypes, the three most predominant capsid genotypes (GII.2, GII.4 and GII.17) across all sites were removed and the distribution of the remaining genotypes plotted as pie charts. The number of reads attributed to non-GII.2, GII.4 and GII.17 are listed below the pie chart