
Figures & data
List of experimentally verified PB2 human-adaptive mutations
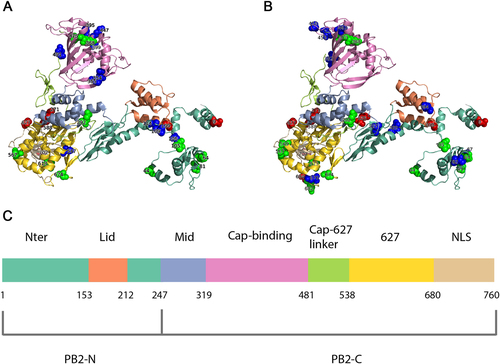
Localization of identified human-adaptive markers in the PB2 domains of seasonal IAVs H1N1 (a) and H3N2 (b). The cartoon representation of PB2 subunit was rendered by Pymol (PDB code: 4WSB). Domains are colored according to the color code in c. Experimentally verified markers are indicated in red sphere, computationally predicted markers are indicated in green, and novel markers are indicated in blue. c The positions of PB2 domains are color-coded and labeled according to their functions
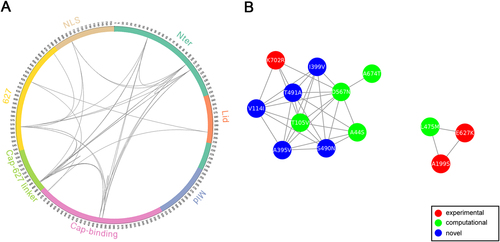
a Circular representation of PB2 protein and the MI network. The positions of PB2 domains are color-coded and labeled according to their functions. Arcs connect site pairs with normalized MI > 0.7. b Cytoscape representation of the MI network. Sites are represented as nodes. Edge between two nodes indicates the normalized MI > 0.7. Sites with experimentally verified human-adaptive mutations and computationally identified markers are highlighted in red and green, respectively, in a, b; blue nodes indicate novel markers
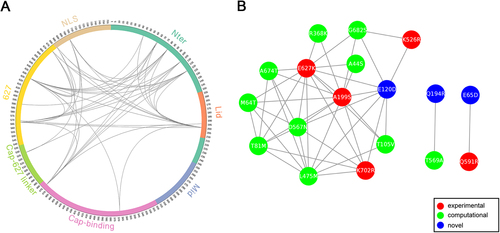
a Circular representation of PB2 protein and the MI network. The positions of PB2 domains are color-coded and labeled according to their functions. Arcs connect site pairs with normalized MI > 0.7. b Cytoscape representation of the MI network. Sites are represented as nodes. Edge between two nodes indicates the normalized MI > 0.7. Sites with experimentally verified human-adaptive mutations and computationally identified markers are highlighted in red and green, respectively, in a, b; blue nodes indicate novel markers
a Correlation of representative H1N1 PB2 sequences from 1918 to 2009 with root-to-tip divergence. b Correlation of representative H3N2 PB2 sequences from 1968 to 2016 with root-to-tip divergence. The x axis represents the evolution time of the MRCA; the y axis represents the sequence divergence from the MRCA. Each dot corresponds to a PB2 protein sequence
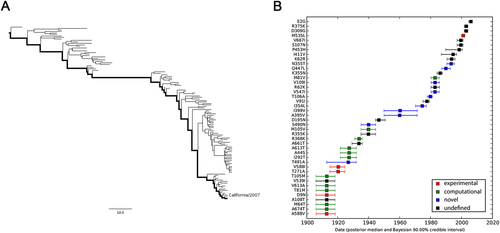
a MCC tree of seasonal H1N1 IAVs circulated between 1918 and 2009. A total of 115 representative PB2 sequences were selected to reconstruct the tree by Bayesian phylogenetic inference. The evolutionary path from the MRCA to the most divergent descendant (A/California/6/2007) is highlighted in the tree. b Reconstructed mutational path from the MRCA to the most divergent descendant. The x and y axes represent the time scale and the mutations in the path, respectively. The median and 90% BCI of estimated date of each mutation are shown in the boxplot. Experimentally verified markers, computationally predicted markers, and novel markers are indicated in red, green, and blue, respectively
a MCC tree of seasonal H3N2 IAVs circulating between 1968 and 2016. A total of 170 representative PB2 sequences were selected to reconstruct the tree by Bayesian phylogenetic inference. The evolutionary path from the MRCA to the most divergent descendant (A/Hawaii/13/2016) is highlighted in the tree. b Reconstructed mutational path from the MRCA to the most divergent descendant. The x and y axes represent the time scale and the mutations in the path, respectively. The median and 90% BCI of estimated date of each mutation are shown in the boxplot. Experimentally verified markers, computationally predicted markers, and novel markers are indicated in red, green, and blue, respectively
Estimated emerging dates of identified markers in seasonal H1N1 and H3N2 PB2