1,255
Views
11
CrossRef citations to date
0
Altmetric
Original Articles

Molecular determinants of Yellow Fever Virus pathogenicity in Syrian Golden Hamsters: one mutation away from virulence

ORCID Icon, , & ORCID Icon
Pages 1-18 | Received 09 Nov 2017, Accepted 11 Feb 2018, Published online: 29 Mar 2018

Figures & data

Fig. 1 Viral strains production using the Infectious Subgenomic Amplicons (ISA) method.

All viral strains were produced using the ISA method. Transfection schemes are detailed for all viruses. *For each of the envelope (E) reversion and functional mutants, a different FI.1 fragment was amplified from the corresponding plasmid. **For YFV Ap7M NS2A/A48T reversion mutant production, FI.1 and FI.2 fragments were amplified from Ap7M and Asibi FI plasmids, respectively. ***For each of the E positive mutants, E/Q27H, E/D28G and E/D155A mutations were introduced in fragment FI.1.2 separately or as a combination of two to three changes, using modified primers (see supplementary Table S1). FI.1.1 and FI.1.2 fragments were subsequently fused in fragment FI.1bis (PCR-fusion step)
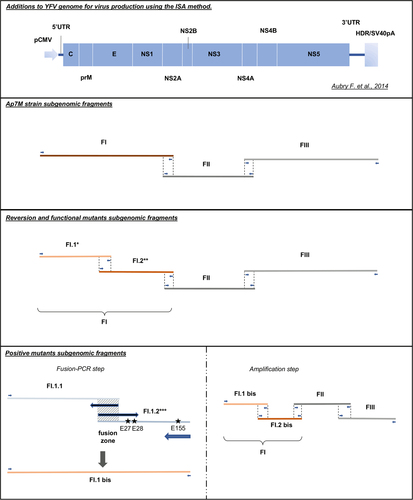
Fig. 1 Viral strains production using the Infectious Subgenomic Amplicons (ISA) method.All viral strains were produced using the ISA method. Transfection schemes are detailed for all viruses. *For each of the envelope (E) reversion and functional mutants, a different FI.1 fragment was amplified from the corresponding plasmid. **For YFV Ap7M NS2A/A48T reversion mutant production, FI.1 and FI.2 fragments were amplified from Ap7M and Asibi FI plasmids, respectively. ***For each of the E positive mutants, E/Q27H, E/D28G and E/D155A mutations were introduced in fragment FI.1.2 separately or as a combination of two to three changes, using modified primers (see supplementary Table S1). FI.1.1 and FI.1.2 fragments were subsequently fused in fragment FI.1bis (PCR-fusion step)
Fig. 2 Description of Ap0, Asibi, Ap7, Ap7M and Ap8 strains.

All viral strains produced and used in this study are detailed above. Synonymous mutations are indicated by light blue rectangles and nonsynonymous mutations by turquoise blue rectangles. Non-synonymous mutations are described in bold characters with a letter indicating the protein affected and the position within the protein sequence. Within the polyprotein sequence, the mature E, NS2A and NS4B protein sequences start at amino-acid (AA) positions 286, 1131 and 2257, respectively. *Ap0 and Ap7 strains description was obtained from McArthur et al. 2003. Asibi strain sequence was downloaded from Genbank (AN: AY640589). Absent mutations are indicated by gray rectangles. We were not able to identify the synonymous mutation on the complete coding sequence (CDS). E/D28G mutation was not found in strain Ap8 sequence
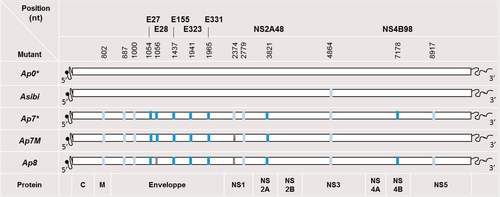
Fig. 2 Description of Ap0, Asibi, Ap7, Ap7M and Ap8 strains.All viral strains produced and used in this study are detailed above. Synonymous mutations are indicated by light blue rectangles and nonsynonymous mutations by turquoise blue rectangles. Non-synonymous mutations are described in bold characters with a letter indicating the protein affected and the position within the protein sequence. Within the polyprotein sequence, the mature E, NS2A and NS4B protein sequences start at amino-acid (AA) positions 286, 1131 and 2257, respectively. *Ap0 and Ap7 strains description was obtained from McArthur et al. 2003. Asibi strain sequence was downloaded from Genbank (AN: AY640589). Absent mutations are indicated by gray rectangles. We were not able to identify the synonymous mutation on the complete coding sequence (CDS). E/D28G mutation was not found in strain Ap8 sequence

Description of Ap7M, reversion, positive and functional mutant strains sequences

Fig. 3 Ap7M and mutant strains in vitro and in vivo phenotypes.

In the top left-hand corner, weight evolution in hamsters during infection with YFV strains Ap7M and Asibi/hamster p8 is detailed. Weight evolution is given for the five and four hamsters that were used for the evaluation of the mortality rate for Ap7M and Ap8 strain, respectively. For the hamsters that were used as negative controls, weight evolution is expressed as a mean of % of initial weight. Hamsters infected with Ap7M strain are represented with black lines, those infected with Ap8 strain, with gray lines and the mean for negative control, with a dotted line. In the top right-hand corner, the survival during infection with YFV strains Ap7M and Asibi/hamster p8 is displayed. The evolution of the proportion of living hamsters is shown by a black line for Ap7M and by a gray dashed line for Ap8. It was calculated using five and four hamsters for Ap7M and Ap8, respectively. In vitro infectious titers, mortality rates, mean viral loads at 2, 5 dpi and 8 dpi/pm, as well as mean normalized percentage of initial weight means are given for all viral strains described in this study. Viral loads, normalized percentage of initial weight and infectious titer evaluations are detailed in the corresponding paragraphs within the materials and methods section. Significant difference between viral loads at 2, 5 dpi and viral loads at endpoint (Wilcoxon rank-sum test p-value < 0.05) was indicated with a “EP” superscript next to the corresponding viral loads’ mean. Significant viral loads difference observed between Ap7M and other viruses at 2, 5 dpi or endpoint (Wilcoxon rank-sum test p-value < 0.05) was indicated using a “A” superscript next to the corresponding viral loads’ mean.
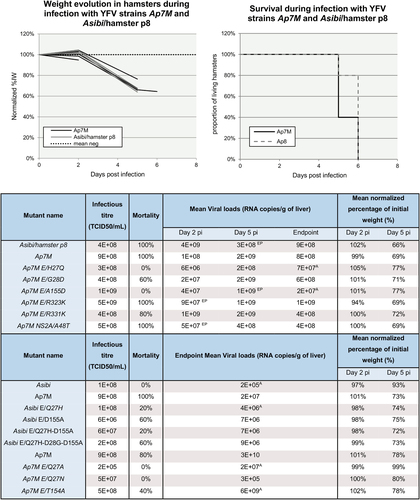
Fig. 3 Ap7M and mutant strains in vitro and in vivo phenotypes.In the top left-hand corner, weight evolution in hamsters during infection with YFV strains Ap7M and Asibi/hamster p8 is detailed. Weight evolution is given for the five and four hamsters that were used for the evaluation of the mortality rate for Ap7M and Ap8 strain, respectively. For the hamsters that were used as negative controls, weight evolution is expressed as a mean of % of initial weight. Hamsters infected with Ap7M strain are represented with black lines, those infected with Ap8 strain, with gray lines and the mean for negative control, with a dotted line. In the top right-hand corner, the survival during infection with YFV strains Ap7M and Asibi/hamster p8 is displayed. The evolution of the proportion of living hamsters is shown by a black line for Ap7M and by a gray dashed line for Ap8. It was calculated using five and four hamsters for Ap7M and Ap8, respectively. In vitro infectious titers, mortality rates, mean viral loads at 2, 5 dpi and 8 dpi/pm, as well as mean normalized percentage of initial weight means are given for all viral strains described in this study. Viral loads, normalized percentage of initial weight and infectious titer evaluations are detailed in the corresponding paragraphs within the materials and methods section. Significant difference between viral loads at 2, 5 dpi and viral loads at endpoint (Wilcoxon rank-sum test p-value < 0.05) was indicated with a “EP” superscript next to the corresponding viral loads’ mean. Significant viral loads difference observed between Ap7M and other viruses at 2, 5 dpi or endpoint (Wilcoxon rank-sum test p-value < 0.05) was indicated using a “A” superscript next to the corresponding viral loads’ mean.

Sequence and intra-population diversity from viral culture supernatant and hamster liver samples for mutant strains Ap7M E/H27Q, E/G28D, E/A155D, E/R323K, E/R331K and NS2A/A48T

Sequence and intra-population diversity from viral culture supernatant and hamster liver samples for mutant strains Asibi E/Q27H, E/D155A, E/Q27H-D155A, E/Q27H-D28G-D155A, Ap7m E/Q27A, E/Q27N, E/T154A

Fig. 4 Location of the Q27H and D155A mutation on the structure of YFV E protein.

The E protein is colored by domains, with domains I, II and III in red, yellow and blue, respectively, and the fusion loop highlighted in green. The “kl hairpin”, at the interface between domains I and II, is indicated. a The E protein as viewed from the external surface of the virion, with the various domains labeled and the location of the mutations indicated by a white arrow. b Side view, with the membrane below and the external side on top. The residues 154 and 155 are indicated, within a two-turn alpha helix in the 150 loop. c Close-up view of the interactions of Glutamine 27 (Gln27). The side chain of Gln27 is in an extended conformation, making an interaction with the polypeptide chain at the end of the kl hairpin (labeled). For comparison, the E protein from TBEV was superposed on domain I, and is represented by a dark gray trace. Although the main chains superpose on domain I, in particular at the level of Q27, the kl hairpin is maintained away with respect to the TBEV kl hairpin (also labeled, in gray) by virtue of the interactions made by the Q27 side chain. This feature suggest that mutation of this amino-acid will affect the conformation of this sensitive zone. d The 150 loop of YFV E protein. For comparison, the TBEV E protein is shown superposed, in gray. The interaction between the D155 and T154 side chains is indicated, potentially stabilizing the alpha-helical conformation of this loop.
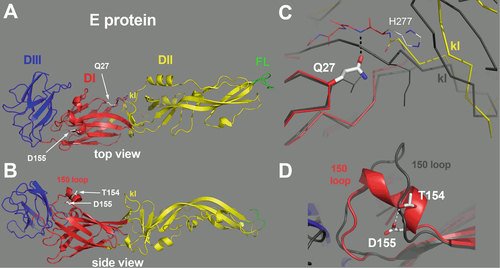
Fig. 4 Location of the Q27H and D155A mutation on the structure of YFV E protein.The E protein is colored by domains, with domains I, II and III in red, yellow and blue, respectively, and the fusion loop highlighted in green. The “kl hairpin”, at the interface between domains I and II, is indicated. a The E protein as viewed from the external surface of the virion, with the various domains labeled and the location of the mutations indicated by a white arrow. b Side view, with the membrane below and the external side on top. The residues 154 and 155 are indicated, within a two-turn alpha helix in the 150 loop. c Close-up view of the interactions of Glutamine 27 (Gln27). The side chain of Gln27 is in an extended conformation, making an interaction with the polypeptide chain at the end of the kl hairpin (labeled). For comparison, the E protein from TBEV was superposed on domain I, and is represented by a dark gray trace. Although the main chains superpose on domain I, in particular at the level of Q27, the kl hairpin is maintained away with respect to the TBEV kl hairpin (also labeled, in gray) by virtue of the interactions made by the Q27 side chain. This feature suggest that mutation of this amino-acid will affect the conformation of this sensitive zone. d The 150 loop of YFV E protein. For comparison, the TBEV E protein is shown superposed, in gray. The interaction between the D155 and T154 side chains is indicated, potentially stabilizing the alpha-helical conformation of this loop.
Supplemental material

Supplementary materials(PDF 207 kb)

Download PDF (207 KB)

Supplementary Table S1(PDF 30 kb)

Download PDF (30.3 KB)

Supplementary Table S2(PDF 93 kb)

Download PDF (93.9 KB)

Supplementary Table S3(PDF 28 kb)

Download PDF (28.9 KB)

Supplementary Table S4(PDF 111 kb)

Download PDF (111.5 KB)

Supplementary Table S5(PDF 104 kb)

Download PDF (104.8 KB)