
Figures & data
Details of the Leptospira-positive samples from terrestrial small mammals and bats used in the analyses, the number of genetic sequences obtained, and the associated Leptospira spp
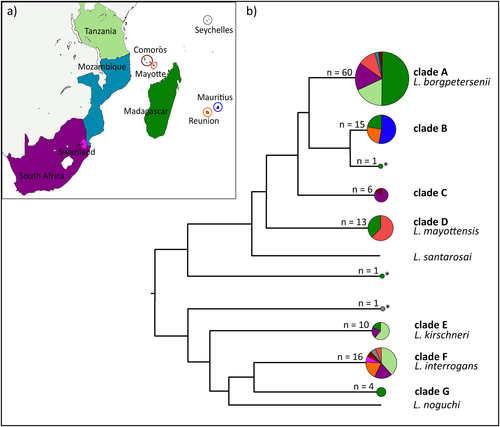
a Map of the sample locations. b Schematic representation of the Leptospira phylogenetic relationships based on the maximum-likelihood secY and rrs2 phylogenetic trees (details in Figures S1 and S2). Circle sizes are proportional to the number of samples included for each branch. Colors within the pie charts refer to the different countries as shown on the map. Samples denoted by an asterisk (*) refer to the sequences that could not be assigned to any clade
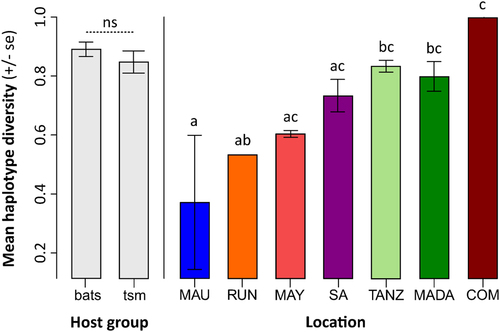
“tsm” refers to terrestrial small mammals. “MAU”=Mauritius, “RUN”=La Réunion, “MAY”=Mayotte, “SA” = South Africa, “TANZ” = Tanzania, “MADA” = Madagascar, “COM” = Union of the Comoros. Letters a–c above the bars refer to significantly different averages based upon a Tukey HSD test and “ns” = non-significant. Bars can have more than one letter to reflect the “overlap” between them
Results of the hierarchical AMOVA analysis
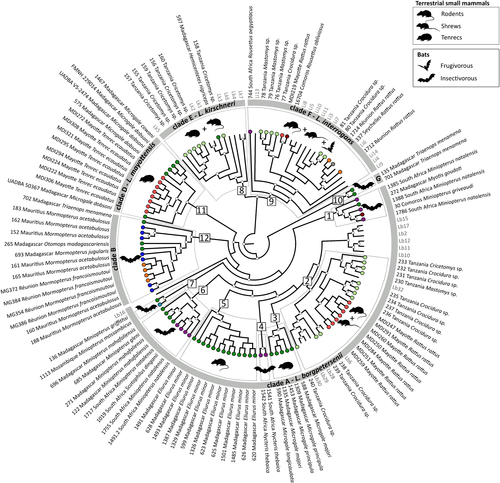
The genetic clades identified in Fig. are shown in the gray circle, and the major genetic groups within these clades (squares, numbers 1 to 12) are highlighted by dashed boxes. Animal silhouettes represent host groups. Sequences from the samples specific to this study are in black and coded with the sample ID, geographic location, and host species/genus. Colored circles at the tip of the branches correspond to the geographic locations as shown in Fig. . Reference samples are in gray and are coded as follow: Li = L. interrogans, Lk = L. kirschneri, and Lb = L. borgpetersenii (see Table S1 for details). Posterior probabilities higher than 80% are represented by white circles at the nodes. Clade C was not included (refer to Results section for more information)
Pairwise distance (FST) among the different genetic Leptospira clades in the western Indian Ocean islands and neighboring Africa