Figures & data
Sample size and positive number of different animals from 2011 to 2015 years
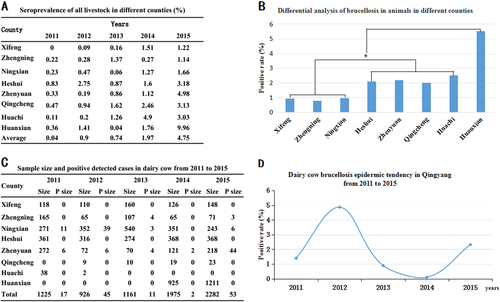
a The positive rates of the different counties in each year. b Differential analysis of brucellosis in different counties from 2011 to 2015. Bar, the average seroprevalence from 2011 to 2015; *Significant difference at P < 0.05. c Sample sizes and positively detected cases in the dairy cow brucellosis epidemic in Qingyang from 2011 to 2015. d Dairy cow brucellosis epidemic tendency in Qingyang from 2011 to 2015
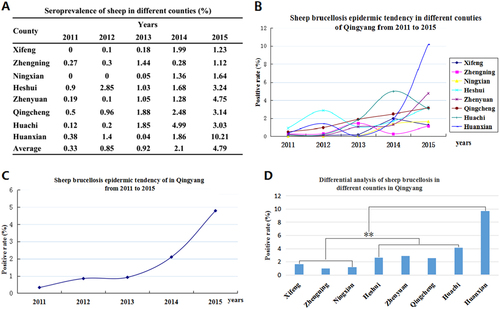
a The positive rates of the different counties in each year from 2011 to 2015. b Sheep brucellosis epidemic tendency in Qingyang from 2011 to 2015. c Sheep brucellosis epidemic tendencies in different counties in Qingyang from 2011 to 2015. d Differential analysis of the seroprevalence in different counties in Qingyang. Bar, the average seroprevalence from 2011 to 2015; **Very significant difference at P < 0.01
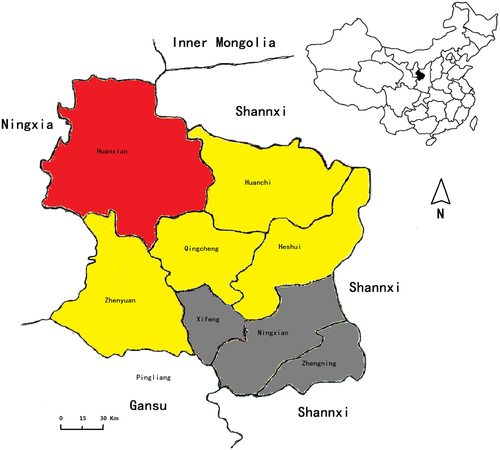
Red area: seroprevalence of 2.71%; yellow area: seroprevalence between 1.50 and 1.90%; gray area: seroprevalence <1%
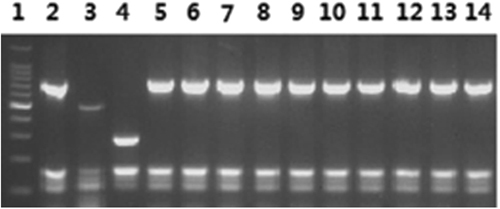
Lane 1: 100-bp DNA ladder; 2: B. melitensis bv. 1 (16 M reference strain); 3: B. abortus 544; 4: B. suis bv. 1 (S2 vaccine); 5–14: the 10 B. melitensis isolates
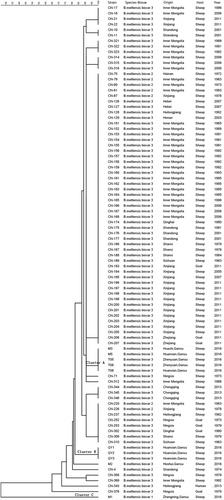
Strain: isolate number; Origin: sample collection area; Host: host from which the strain was isolated; Year: time of isolation
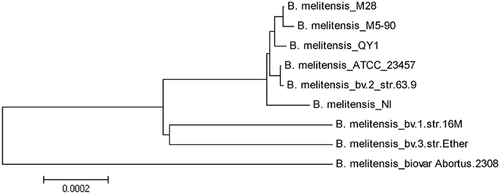
The evolutionary history was inferred using the neighbor-joining method. The optimal tree (with branch length sum = 0.00316668) is shown. The tree is drawn to scale, with branch lengths in the same units as those of the evolutionary distances used to infer the phylogenetic tree