Figures & data
Hu-BLT mice used in this study
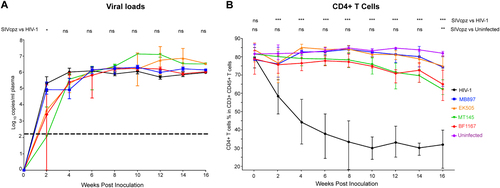
(A) Mean plasma VL kinetics over the course of 16 weeks pi. Five groups of hu-BLT mice (n = 5/each group) were inoculated with a high dose of SIVcpz closely related to the ancestral viruses of HIV-1 groups M (SIVcpzMB897) and N (SIVcpzEK505), two lineages of SIVcpz strains that have not been associated with any known HIV-1 infections in humans (SIVcpzMT145 and SIVcpzBF1167), and HIV-1. Each group is color coded. The dashed line indicates the detection limit of pVL. Statistical significance is indicated with stars. NS non-significance, *<0.05, **<0.01, ***<0.001. (B) CD4+ T-cell depletion in four different SIVcpz- and HIV-1-infected hu-BLT mice. The CD4+ T-cell percentage in the total T cells of five groups of infected hu-BLT mice were quantified. Each group is color coded. Statistical significance is indicated with stars. NS non-significance, *<0.05, **<0.01, ***<0.001
CD4+ T cells in whole sections of splenic tissues were detected using immunohistochemical staining. CD4+ T cells are stained blue. Scale bar, 200 µm

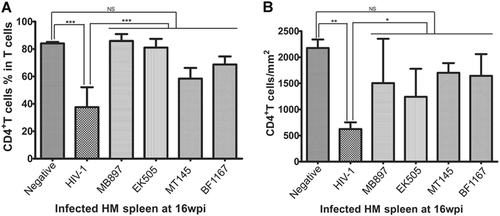
(A) The CD4+ T-cell percentage in the total T cells from splenic tissues of each group (n = 5) were quantified using flow cytometry at 16 wpi. (B) CD4+ T-cell counts per square millimeter of spleen tissues were quantified after IHCS at 16 wpi. Statistical significance is indicated with stars. NS non-significance, *<0.05, **<0.01, ***<0.001
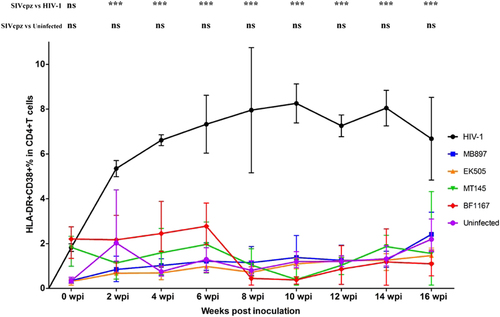
CD38+ HLA-DR+ ratios in the CD4+ T cells of the five groups (n = 5/each group) were measured. Each group is color coded. Statistical significance is indicated with stars. NS non-significance, *<0.05, **<0.01, ***<0.001
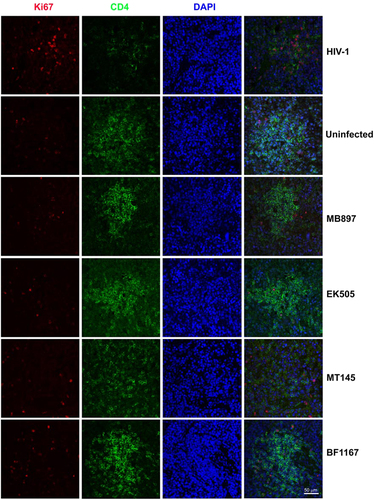
Human CD4+ T cells are shown in green, human Ki67+ cells in red, and DAPI in blue. Each row is labeled by the virus strain used for infecting the animals. Scale bar, 50 µm
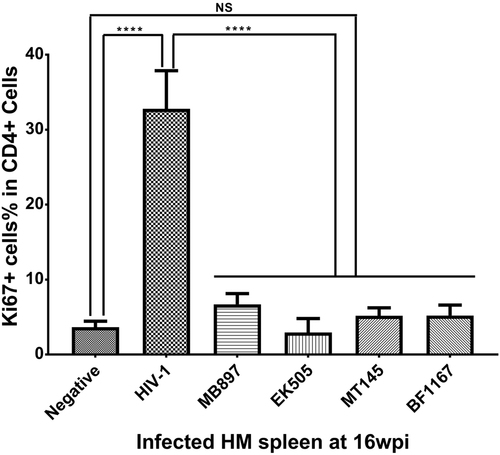
Statistical significance is indicated with stars. NS non-significance, ***<0.001
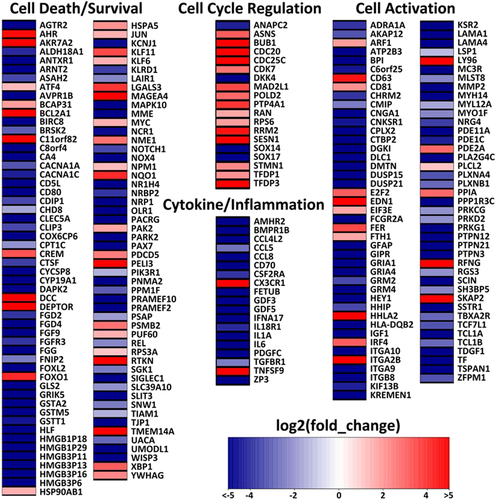
Heat map of differentially expressed genes (DEGs) in SIVcpz-infected animals compared with HIV-1-infected animals. Log2 fold change is color coded with a range from less than −5 to greater than 5