Figures & data
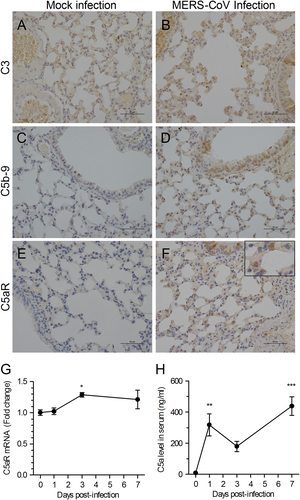
a–f Representative images of lung tissue sections from MERS-CoV-infected or Mock-infected hDPP4-transgenic mice by immunohistochemical staining for C3, C5b-9, and C5aR (n = 5 per group). g Transcriptional expression of C5aR in lung tissues at different time points after MERS-CoV infection (n = 3–5 per group). h Concentration of C5a in sera at different time points after virus infection was measured by a quantitative enzyme-linked immunosorbent assay (ELISA). Data are expressed as the means ± SEM (n = 5 per group). *P < 0.05, **P < 0.01, and ***P < 0.001 (one-way analysis of variance (ANOVA) with Dunnett’s post-test)
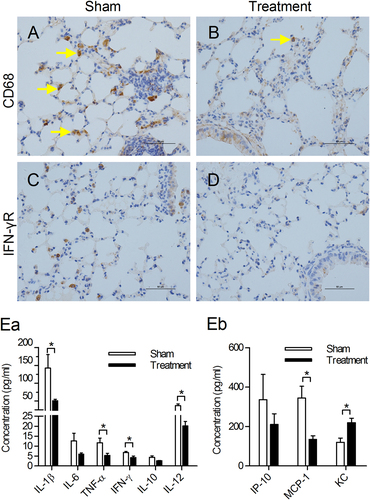
a–d Infiltration of macrophage (a–b) and the expression of IFN-γ receptor (c–d) were assessed by immunohistochemical staining in the lungs 3 days after challenge (CD68+ macrophages were indicated by arrows). e Sera from the two groups of mice were collected on day 3 and assayed for the levels of IL-1β, IL-6, TNF-α, IFN-γ, IL-10, IL-12 (ea), KC, MCP-1, and IP-10 (eb). The results are the mean ± SEM (n = 5). *P < 0.05 (Student’s t test with Welch’s correction)
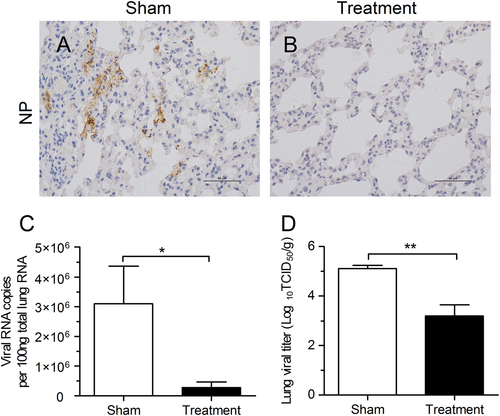
a–b Representative images of immunohistochemical staining of MERS-CoV antigen in lungs on day 7 after challenge in the sham treatment and anti-C5aR Ab treatment groups. c Viral RNA copies in lung tissues in the sham treatment and anti-C5aR Ab treatment groups. d Virus titer in lungs on day 7 after challenge in the sham treatment and anti-C5aR Ab treatment groups. Data are expressed as the means ± SEM (n = 5 per group). *P < 0.05, **P < 0.01 (Student’s ttest with Welch’s correction)
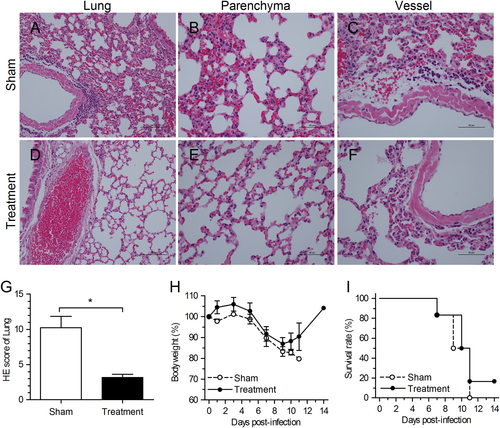
a–f Hematoxylin and eosin (H&E) staining of lung tissue sections obtained 7 days after anti-C5aR Ab treatment. Lung tissues in the sham treatment group presented mild to severe interstitial pneumonia, whereas those in the treatment group were less severe, with only mild focal thickening of alveolar septa. g Semi-quantitative histopathological analysis of H&E-stained lung sections 7 days after challenge. *P < 0.05 (Student’s ttest with Welch’s correction). h–i Body weight and survival rate after challenge. An additional six mice in each group were weighed and monitored. The experiment was repeated once and data from one representative experiment of these two experiments is presented
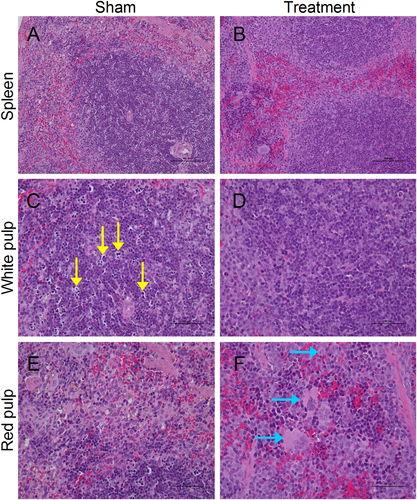
a–f Representative images of spleen tissue sections with hematoxylin and eosin (H&E) staining on day 7 after viral challenge. Numerous splenic cells presented necrosis or apoptosis, especially in the white pulp (yellow arrow). Mice with the anti-C5aR Ab treatment had less spleen damage with less splenic necrosis and apoptosis, and increased numbers of macrophages were detected in red pulp (blue arrow) (n = 5 per group)
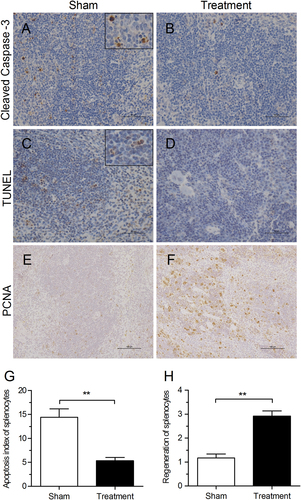
a, b Apoptosis of splenic cells was assessed by immunohistochemical staining of cleaved caspase-3 in spleen tissues 7 days after challenge. c, d Apoptosis of splenic cells was detected using a DAB TUNEL-based apoptosis detection assay in spleen tissue 7 days after challenge. e, f Representative images of regenerated splenic cells detected by IHC staining of PCNA 7 days after challenge. g Apoptosis index of splenocytes was assessed according to TUNEL-based apoptosis detection in spleen sections 7 days after challenge. h Semi-quantitative analysis of PCNA-positive cells in spleen sections 7 days after challenge (n = 5 per group)