Figures & data
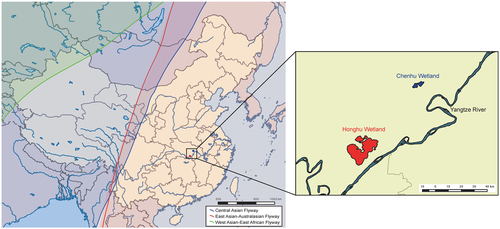
Both the Chenhu wetland and Honghu wetland are located in the East Asian-Australasian migratory flyway. The migration flyways in China were mapped by ArcGIS Desktop 10.2 software (http://www.esri.com/software/arcgis/arcgis-for-desktop/)
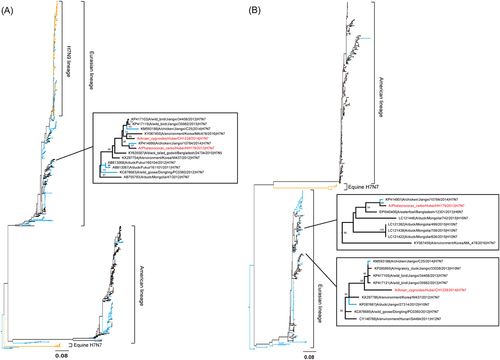
a HA and b NA. Virus strain names are colored by host: blue for poultry, orange for human and mammals and black for wild birds and environment samples. The CH1228/H7N7 and HH179/H7N7 strain names are marked in red
Evolution rate of eight segments
Time of most recent common ancestor (tMRCA) for each of the eight segments
Samples were collected at corresponding days post infection, and viral titers were determined by TCID50. Based on the viral titers, regression lines were simulated, and the estimated regression days of both H7N7 viruses were determined. All experiments were performed in triplicate for each water sample, and the titers at individual sampling dates represent the averages of triplicate experiments and the S.D. values
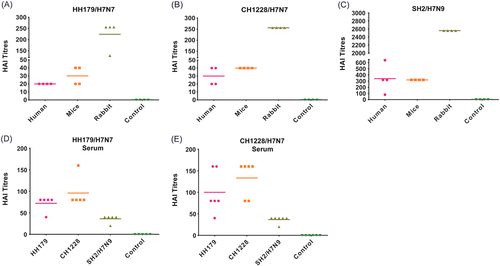
a–c Anti-serum from human H7N9 patients, H7N9 infected mice and immunized rabbit were tested for HAI titers against heterologous H7N7 and homologous H7N9. d, e Anti-serum from mice infected with HH179/H7N7 and CH1228/H7N7 were tested for HAI titers against homologous H7N7 and heterologous H7N9 viruses. The control sera were from non-exposed humans, naive mice, non-immunized rabbits (a–c) and naive mice (d, e). No HAI activity was detected with control sera, and the data are only shown as a control column
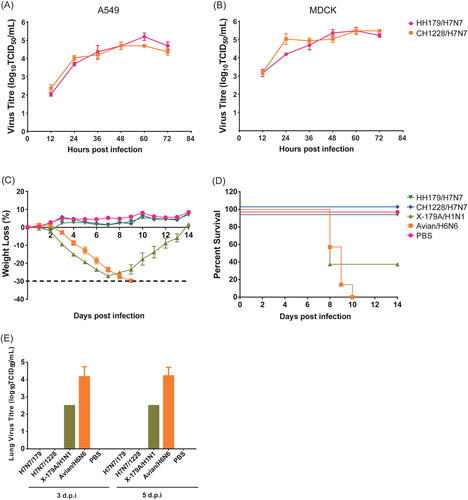
Multiple-cycle growth curves of migratory waterfowl H7N7 viruses in A549 (a) and MDCK (b) cells. Pathogenicity of the H7N7 viruses was analyzed in BALB/c mice. As controls, mouse-adapted poultry strain A/duck/Hubei/5/2010 (H6N6) and 2009 pandemic vaccine strain NYMC X-179A (A/reassortant/NYMC X-179A (California/07/2009 × NYMC X-157) (H1N1)) were infected in parallel. HH179/H7N7 and CH1228/H7N7 were inoculated into the mice of each group by the intranasal route at a dose of 106 EID50. Mice were infected with 5 MLD50 H6N6 and 1 MLD50 NYMC X-179A. Mice in the control group were mock infected with phosphate-buffered saline (PBS). c Body weights were monitored daily for a 14-day observation period, and weight changes are expressed as a percentage of the initial value (measured on the day of challenge). d Kaplan–Meier survival curve. e Lung viral titers were determined at 3 and 5 dpi by TCID50 on individual lung homogenates from infected mice