
Figures & data
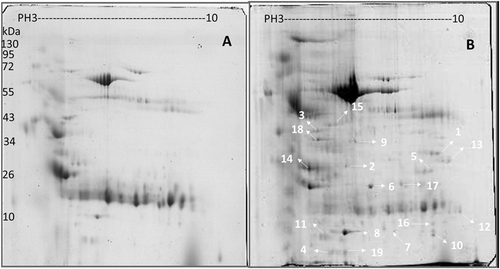
Comparison of (a) healthy individuals and (b) pulmonary tuberculosis patient proteins in pH 3–10 separated on 2-DE gels. Isoelectric points are indicated at the top and molecular weight markers in kDa on the left. The data are representative of two separate experiments. A p-value <0.05 indicates statistical significance using the two-tailed t-test
Characteristics of proteins identified in this study
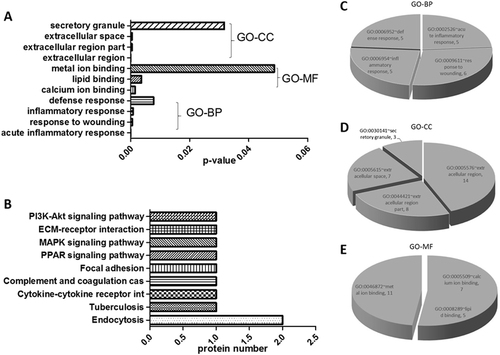
a Gene ontology (GO) enrichment analysis; b KEGG pathway mapping; c biological processes; d cellular component; and e molecular function. A p-value <0.05 indicates statistical significance using a binomial test
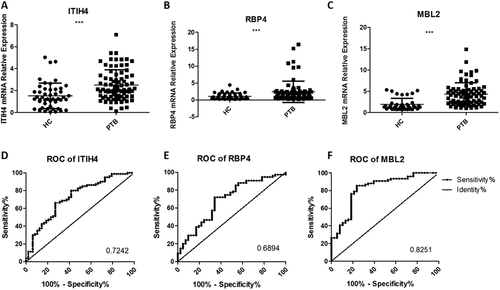
The relative contents of three identified urine proteins from tuberculosis patients and healthy controls determined using a qRT-PCR assay (a–c) and ROC curve analyses (d–f). The contents of the miRNAs were normalized to U6 and calculated using the 2−ΔΔCt method. Each point represents the mean of triplicate samples. A p-value <0.05 indicates statistical significance with a non-parametric analysis using the two-tailed unpaired t-test. **p < 0.01, ***p < 0.001
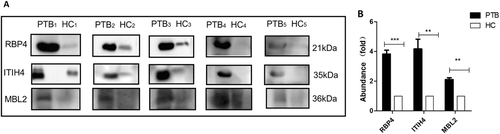
Samples were analyzed using immunoblotting to facilitate comparisons of RBP4, ITIH4-35k, and MBL2 levels (a). Twenty-five pulmonary tuberculosis (PTB) patients and 25 healthy controls (HC) were randomly divided into five subgroups (PTB1 to PTB5; HC1 to HC5), each containing five individuals. The samples of each subgroup were pooled and detected in one lane, and each pair consisted of PTB patients and healthy control subgroups. b The densitometry quantification of the results of (a) using Image J software; p-values between the two groups with the two-tailed unpaired t-test. **p < 0.01, ***p < 0.001
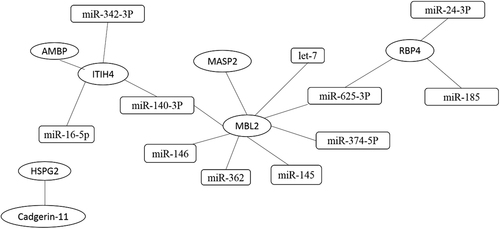
Interactions between proteins are based on the reported literature. Interactions between proteins and miRNAs using four websites. The ellipse represents miRNA, and the rectangle represents proteins
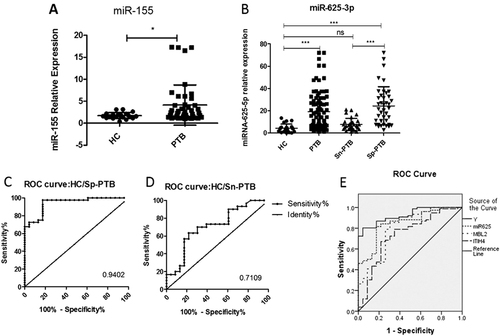
a The expression of the positive control miR-155 in the PTB group and healthy controls; b the relative contents of miR-625-3p in Sn-PTB and Sp-PTB patients and healthy controls determined using qRT-PCR assay and ROC curve analysis between healthy controls compared with Sp-PTB patients (c); Sn-PTB patients compared with healthy controls (d); (e) the ROC analysis of Y (binary logistic regression model with miR-625-3p, ITIH4-35k, and MBL2), miR-625-3p, ITIH4-35k, and MBL2. The contents of the miRNAs were normalized to RNA U6. A p-value <0.05 indicates significance using the two-tailed unpaired t-test
Information of TB patients and healthy control