Figures & data
Fig. 1 Phylogenetic analysis was performed based on a 346-nt partial sequence of the RNA-dependent RNA polymerase gene with the Maximum Likelihood method based on the Tamura 3-parameter model (+G+I). For the maximum-likelihood tree, the best fit nucleotide substitution model was selected based on the Bayesian information criterion as implemented in MEGA7 softwareCitation13. Bootstrap replications were 1000. The sequence in this study is indicated with bold letters. Branch supports are represented by bootstrap values. Bootstrap values less than 50 are not shown. Branch lengths are measured in the number of substitutions per site.
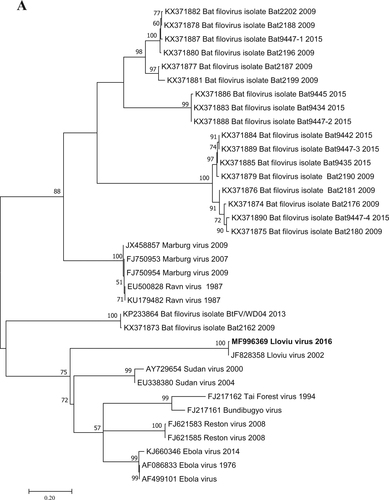
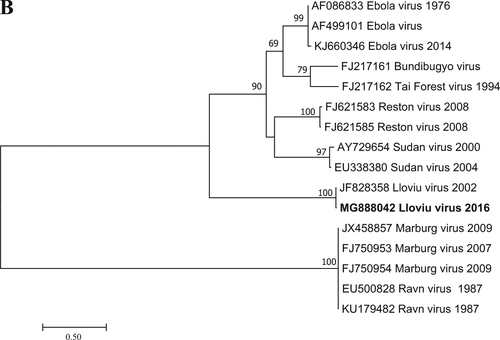
Fig. 2 Phylogenetic tree analysis was performed based on a 717-nt partial sequence of the nucleoprotein gene with the Maximum Likelihood method based on the Tamura 3-parameter model (+G+I) in MEGA7 softwareCitation13. Bootstrap replications were 1000. The sequence of this study is indicated with bold letters. Branch supports are represented by bootstrap values. Bootstrap values <50 are not shown. Branch lengths are measured in the number of substitutions per site