Figures & data
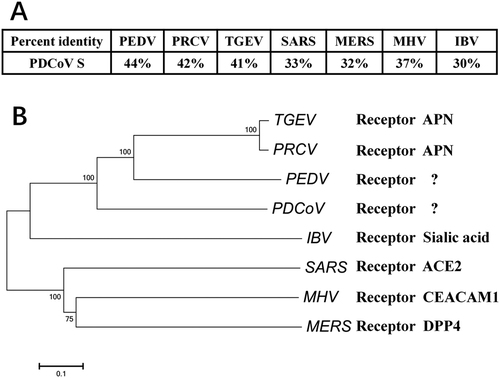
a Alignment of the deduced amino acid sequence of S proteins from PDCoV (GenBank accession no. ALS54086.1), PRCV (GenBank accession no. ABG89317.1), TGEV (GenBank accession no. ADY39740.1), PEDV (GenBank accession no. AHZ94887.1), SARS-CoV (GenBank accession no. ABD73002.1), MERS-CoV (GenBank accession no. AKS48062.1), MHV (GenBank accession no. AFD97607.1), and IBV (GenBank accession no. AKN20490.1). b S protein sequences from different CoVs were analyzed with the neighbor-joining method using Molecular Evolutionary Genetics Analysis (MEGA) softwareCitation58. Each bootstrap value was determined by 1000 replicates, and bootstrap values >50% are shown. The scale bar represents the relationship between line lengths and sequence dissimilarities
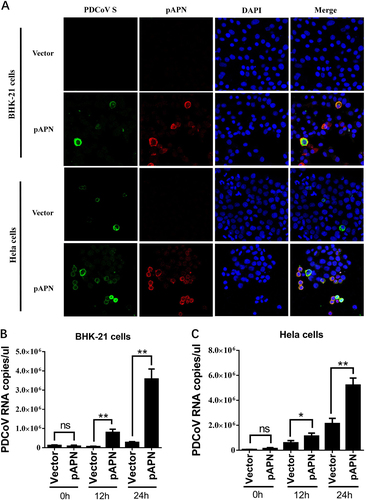
a BHK-21 cells or HeLa cells were cultured in 24-well plates and transfected with 1 μg of pAPN expression plasmid or emptor vector. After 24 h, cells were infected with PDCoV (MOI = 2). At 24 h post infection, cells were fixed and analyzed for IFA. Mouse monoclonal antibody against PDCoV S was used to detect PDCoV-infected cells (green). The anti-Flag rabbit polyclonal antibody was used to stain for ectopic expression of APN protein (red). DAPI was applied to detect nuclei (blue). b, c BHK-21 cells (b) or HeLa cells (c) were transfected as described in a and then infected with PDCoV (MOI = 2). At different time points (0, 12, 24 h) post infection, cells were collected for RT-qPCR with primers targeting the PDCoV nsp16 gene to measure viral genome copies. Data are expressed as the mean ± SD for triplicate wells. Statistical significance was determined by Student’s t test; ns, P > 0.05; *P < 0.05; **P < 0.01
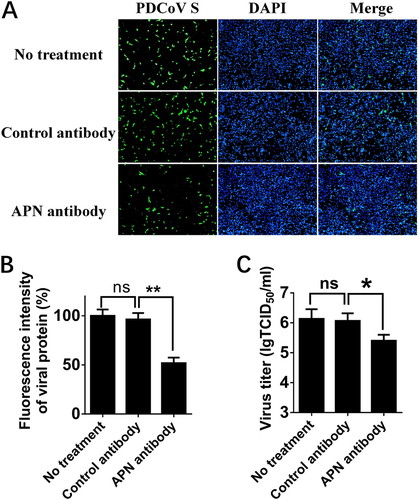
a IPI-2I cells were treated with anti-APN rabbit polyclonal antibody, anti-Flag rabbit polyclonal antibody or no antibody (control) for 2 h and then infected with PDCoV (MOI = 2). After 24 h, cells were analyzed by IFA. Mouse monoclonal antibody against PDCoV S was used to detect PDCoV-infected cells (green). DAPI was applied to detect nuclei (blue). b The fluorescence intensity in a was quantified with the software ImageJ. Error bars show standard deviations. c IPI-2I cells were treated with antibody and infected with PDCoV as described in a. Cells underwent three freeze/thaw cycles, and LLC-PK1 cells were used to measure viral titer by TCID50 assay. Data are expressed as the mean ± SD for triplicate samples. Statistical significance was determined by Student’s t test; *P < 0.05
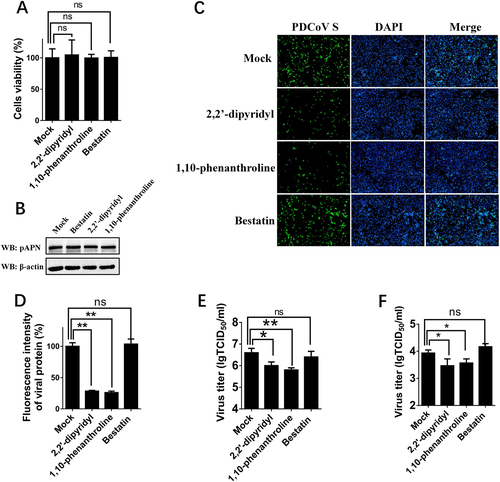
a Cytotoxicity detection of 2,2′-dipyridyl, 1,10-phenanthroline, and bestatin by MTT assay. IPI-2I cells cultured in the 96-well plates were incubated with 2,2′-dipyridyl (250 μM), 1,10-phenanthroline (15 μM), or bestatin (300 μM). At 24 h after incubation, the inhibitors were removed, and MTT reagents (20 μL, 5 mg/mL) were added. After another 4 h incubation, the medium was discarded, and 150 μL of dimethyl sulfoxide (DMSO) solution was added. The OD value at 570 nm was measured. b The expression levels of APN in cells after treatment with the three inhibitors. IPI-2I cells were cultured in six-well plates and treated with 2,2′-dipyridyl (250 μM), 1,10-phenanthroline (15 μM), or bestatin (300 μM). At 24 h after treatment, the expression of endogenous pAPN was detected by western blot with anti-APN rabbit polyclonal antibody. c 2,2′-Dipyridyl (250 μM), 1,10-phenanthroline (15 μM), or bestatin (300 μM) was added to IPI-2I cells for 1 h. Cells were then infected with PDCoV (MOI = 2). At 24 h post infection, cells were analyzed by IFA. Mouse monoclonal antibody against PDCoV S was used to detect PDCoV-infected cells (green). DAPI was applied to detect nuclei (blue). d The fluorescence intensity in c was quantified with ImageJ. e, f IPI-2I cells were treated with the three inhibitors as described in c and infected with PDCoV (MOI = 2 in e or MOI = 0.2 in f). At 24 h post infection, cells were collected, and the TCID50 was determined in LLC-PK1 cells. Data are expressed as the mean ± SD for triplicate samples. Statistical significance was determined by Student’s t test; ns, P > 0.05; *P < 0.05; **P < 0.01
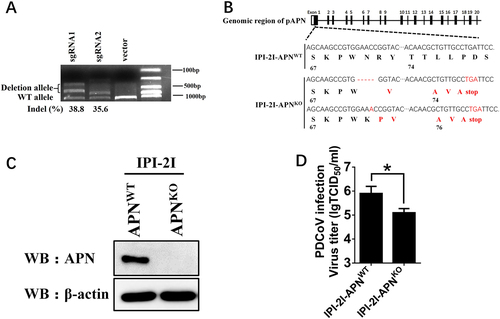
a sgRNA1 and sgRNA2 expression plasmids (1 μg) targeting exon 1 of the pAPN genome were transfected into IPI-2I cells. Total DNA was collected, and the surveyor nuclease assay was conducted to calculate indel occurrence. b The target sequence in isolated clonal cells was amplified through PCR and cloned into the pMD18-T vector. Edited nucleotides in pAPN gene alleles are shown according to sequencing analysis. c Isolated clonal IPI-2I-APNKO cells were cultured in 6-well plates, and the expression of endogenous pAPN was detected by western blot with anti-APN rabbit polyclonal antibody. d IPI-2I-APNKO and IPI-2I-APNWT cells were cultured in 24-well plates and infected with PDCoV (MOI = 2). At 24 h post infection, cells were collected, and the viral titer was determined by TCID50 assay in LLC-PK1 cells. Data are expressed as the mean ± SD for triplicate samples. Statistical significance was determined by Student’s t test; *P < 0.05
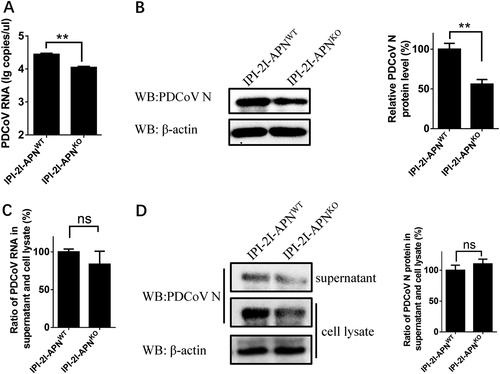
a, b IPI-2I-APNWT and IPI-2I-APNKO cells were inoculated with PDCoV (MOI = 30) at 4 °C. After 1 h, the infected cells were washed three times with cold PBS and cultured at 37 °C for another 1 h. Then, the infected cells were washed with citrate buffer solution (pH = 3) to remove the bound but non-internalized virus particles. The cells were harvested for RT-qPCR assay (a) and western blot (b). c, d IPI-2I-APNWT and IPI-2I-APNKO cells were inoculated with PDCoV (MOI = 2) at 4 °C for 1 h and washed with cold PBS. At 24 h post infection, the ratio of PDCoV RNA copy number and PDCoV N protein level in the supernatants vs. the cell lysates were separately detected by RT-qPCR (c) and western blot (d), respectively. The PDCoV protein level was quantified by ImageJ. Statistical significance was determined by Student’s t test; ns, P > 0.05; *P < 0.05; **P < 0.01
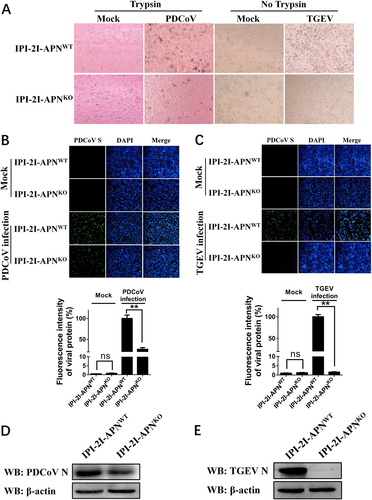
a IPI-2I-APNWT and IPI-2I-APNKO cells seeded in 24-well plates were inoculated with PDCoV (MOI = 2) or TGEV (MOI = 1). At 24 h post infection, CPE was examined to compare the production of infectious progeny virus. b, c IPI-2I-APNWT and IPI-2I-APNKO cells were infected with PDCoV (b) or TGEV (c) as described in a. At 24 h post infection, PDCoV S- or TGEV M-specific fluorescence was detected by IFA. The fluorescence intensity was quantified with ImageJ. d, e IPI-2I-APNWT and IPI-2I-APNKO cells were seeded in six-well plates and infected with PDCoV (d) or TGEV (e) as described in a. At 24 h post infection, cells were collected for western blot analysis with antibodies against N protein of PDCoV (d) or TGEV (e)
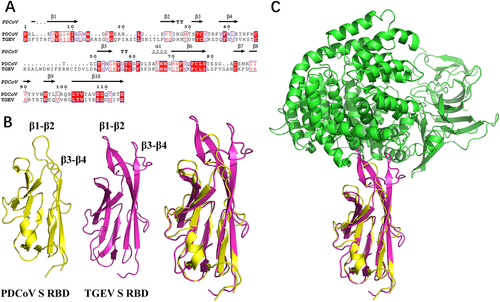
a Sequence alignment was conducted with PDCoV S1-CTD (GenBank accession no. ALS54086.1) and TGEV S1-CTD (GenBank accession no. ADY39740.1). The secondary structures of S1-CTD were analyzed using the ESPript website (http://espript.ibcp.fr/ESPript/ESPript/index.php). b, c The three-dimensional structures of PDCoV S1-CTD (yellow; PDB ID 6B7N), TGEV S1-CTD (red; PDB ID 4F2M), and pAPN (blue; PDB ID 4F5C) obtained from the Protein Data Bank were analyzed with PyMOL software