Figures & data
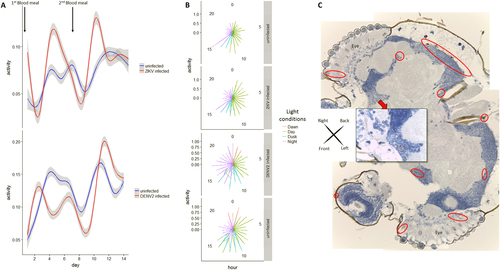
a Generalized additive modeling for Aedes aegypti activity time series analysis (number of movements per frame normalized by the number of females present in the cage) post infectious blood-meal (0 dpi, first blood-meal) and non-infectious second blood meal (7 dpi). Curves are smoothed by generalized additive model based on a cubic regression spline. b Graphs with polar coordinates representing females activity in respect to “day” (100% light), “night” (0% light), “dawn” (50% then 10% light) and “dusk (10% then 50% light). c Mosaic of head sections of an Aedes aegypti female at two weeks post oral-ZIKV infection with pan-flavivirus NS1 detection (red circles for ×4 magnification and red square for ×40 magnification site)
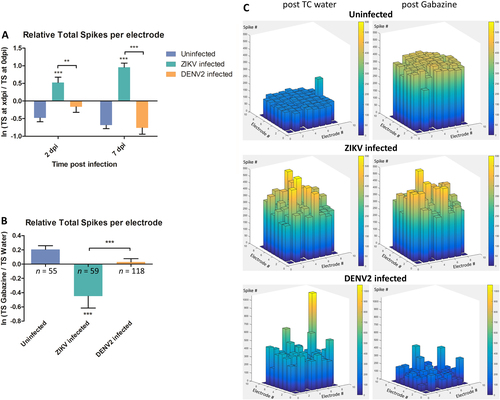
a Spontaneous spiking activity with average ratio of total spike (TS) number per electrode between 0 dpi (reference) and TS number at 2 and 7 dpi of spontaneous activity. b Mosquito neurons stimulated activity with average ratio of TS number per electrode between gabazine stimulus and solvent (water) introduction; n = number of active electrodes. c 3D electrode activity maps of the effect of gabazine stimulation on mosquito neuronal networks for 2 min, post water as baseline and post gabazine. Statistical differences were calculated with unpaired t tests by comparing uninfected group to infected groups unless indicated by bracket. *P < 0.05; **P < 0.01; ***P < 0.001; means ± SEM. For (a), n values are detailed in Supplementary Table S2
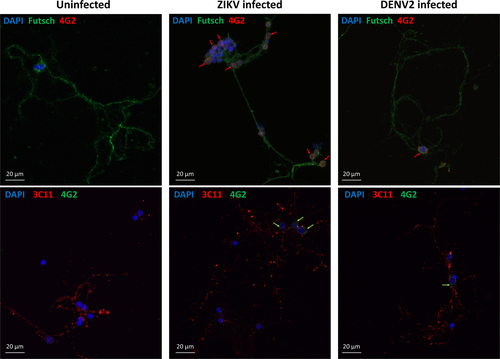
a ZIKV replication dynamics (using TCID50 in Vero cells) in primary neurons from mosquito primary neuron cultures (n = 3 per condition). b Confocal images of mosquito primary neuron culture post ZIKV and DENV2 infection at 7 dpi. In red is 3C11 antibody, corresponds to Synapsin-1, and in green is Futsch antibody, a MAP1B homolog. Each confocal image has its respective image showing stained signal after applying image threshold with ImageJ. Quantification of 3C11 signal (c) and Futsch puncta (d) in mosquito neuron cultures, normalized by the number of DAPI counts. Statistical differences were calculated with Mann–Whitney U tests by comparing 0 dpi to the other groups unless indicated by bracket. *P < 0.05; **P < 0.01; ***P < 0.001; means ± SEM. For (c) and (d), n values are detailed in Supplementary Table S4
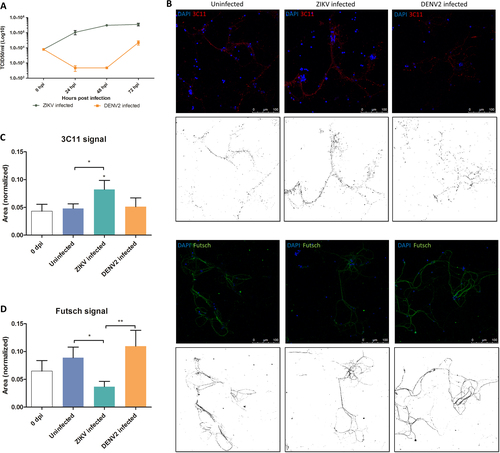
Confocal images of mosquito primary neurons infected with ZIKV or DENV2. Virus signal is indicated by arrows next to the cell nuclei (DAPI in blue) either in co-staining with Futsch or Synapsin proteins (3C11)
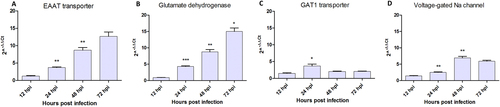
Quantification of (a) Glutamate transporter (EEAT), (b) Glutamate dehydrogenase (GD1), (c) GABAA transporter (GAT1) and (d) Voltage-gated sodium channel (VGNaC) mRNA expression. Statistical differences were calculated with unpaired t tests by comparing mRNA expression at timei to timei−1 within each group (n = 3). *P < 0.05; **P < 0.01; ***P < 0.001; means ± SEM