
Figures & data
Antigenic characterization by the hemagglutination inhibition assay of H3 viruses isolated from free-range ducks in Bangladesh
Antigenic characterization by the hemagglutination inhibition assay of H7 viruses isolated from free-range ducks in Bangladesh
a Daily weight loss was calculated as the percentage of weight relative to that at 0 dpi, and mean weight loss for each group is shown. b Mortality was recorded based on actual death or killing at 25% weight loss, according to our protocol. For each virus isolate, five mice were infected. c Lung tissues were collected at 3 dpi, and viral titers were determined by EID50 assays. Error bars indicate standard deviation, and the dotted line indicates the lower limit of detection of the infectious virus
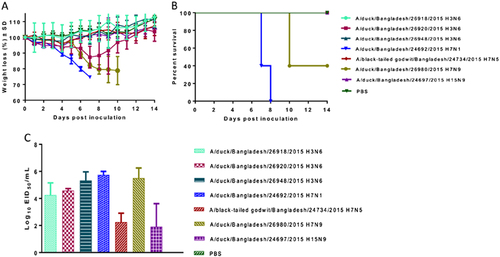
Pathogenicity in DBA/2J mice infected with avian viruses isolated from free-range ducks and wild birds
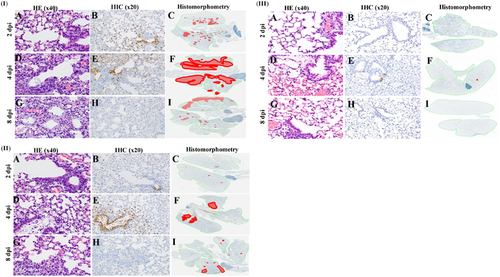
Replication kinetics of H7 AIVs in lung and extrapulmonary tissues in mice
. Mouse lungs were fixed in 10% neutral buffered formalin and stained with hematoxylin-eosin (HE), subjected to immunohistochemical (IHC) staining with anti–NP antiserum, or analyzed by histomorphometry (magnification: ×40 HE, ×20 IHC, and ×2 histomorphometry). In the histomorphometry images, the total lung areas examined are outlined in green; areas of active infection with antigen-positive cells are shown in red
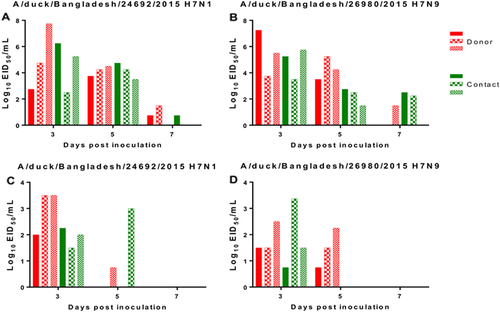
Viral titers in cloacal (a, b) and oropharyngeal (c, d) swabs of mallard ducks infected with A/duck/Bangladesh/24692/2015 H7N1 and A/duck/Bangladesh/26980/2015 H7N9 viruses. Virus shedding of both donor and contact ducks was monitored, and swabs were collected at 3, 5, and 7 dpi and dpc. The dotted line indicates the lower limit of detection of the infectious virus. dpi days post inoculation, dpc days post contact
Comparison of amino acid sequences and IVPI of viruses isolated from free-range ducks in Bangladesh