
Figures & data
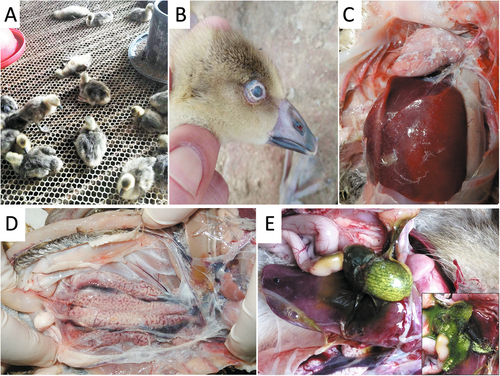
a Goslings appear depressed and lethargic. b Infected goslings with gray-white cloudy palpebra tertia. c Visceral urate deposition over the heart and liver. d Urate deposition and swollen kidney. e Distended bile sac and urate particles (insert)
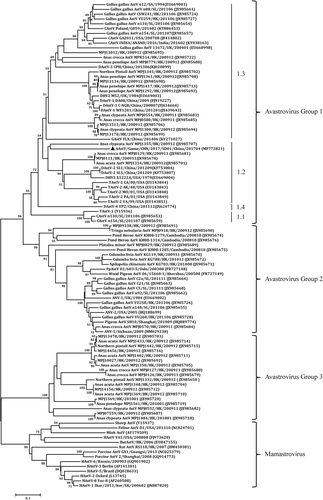
The tree was constructed based on about 391 nt (nucleotide) sequence, by using the Neighbor-joining method with 1000 bootstrap replicates and Maximum Composite Likelihood model. Node labels indicate bootstrap values, and bootstrap values <50% were hided. The location (HK Hong Kong, SL Sri Lanka, UK United Kingdom, SK South Korea, SA South Korea) and time of sample collected was shown. The AAstV/Goose/CHN/2017/SD01 isolate determined in this work is indicated by a black triangle
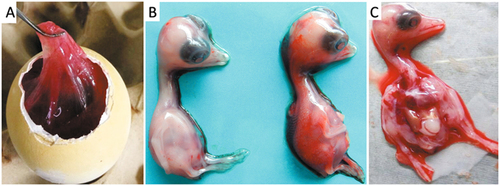
a Edema of the chorioallantoic membrane. b Uninfected embryo (left) and infected embryo with subcutaneous hemorrhage (right). c Infected embryo with liver necrosis
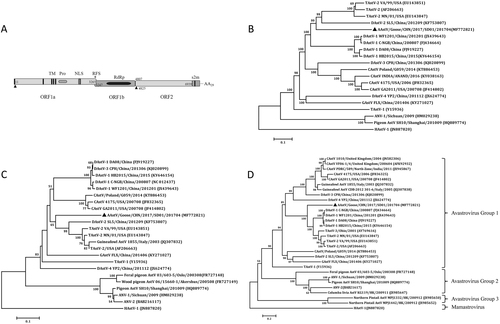
a Predicted genome organization of goose astrovirus AAstV/Goose/CHN/2017/SD01. The translation start sites of two ORFs are indicated by black triangles. b Phylogenetic relationship analysis based on the nucleotide sequences of the complete genome. c Phylogenetic relationship analysis based on the amino acid sequences of ORF1b and ORF2 (d). Human astrovirus (HAstV-1) was used as an outgroup. The trees were generated using MEGA 7.0 software and the Neighbor-joining method with 1000 bootstrap replicates. GenBank accession numbers of the sequences are indicated in parentheses. The AAstV/Goose/CHN/2017/SD01 isolate determined in this work is indicated by a black triangle
Comparison of the nucleotide and amino acid identities of AAstV/Goose/CHN/2017/SD01 with selected representative astroviruses
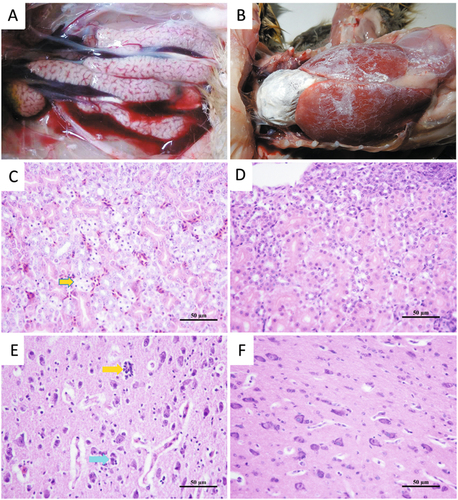
a Mild swelling of kidneys observed in a gosling infected at 2 days old. b Urate deposition over the heart and liver of a dead gosling infected at 5 days old. c Renal tubular necrosis (yellow arrow) in a dead gosling infected at 2 days old (H&E). d Normal kidney section of an uninfected gosling (H&E). e Neuronophagia (blue arrow) and microgliosis (yellow arrow) in the cortex of the cerebrum and the dying neuron surrounded by satellite microglia in a gosling infected at 2 days old (H&E). f Normal brain section of an uninfected gosling (H&E)
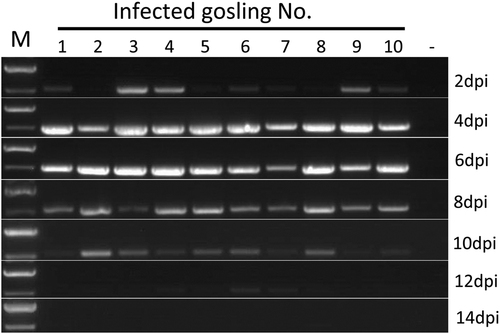
M DNA marker; dpi days post-infection
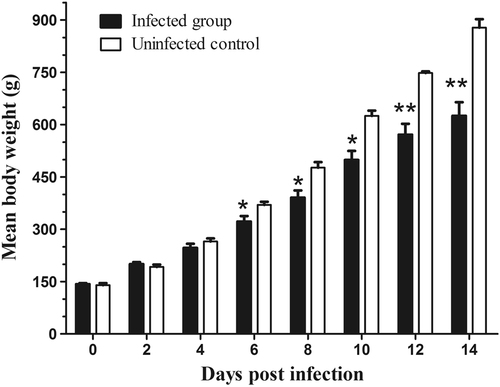
All values are presented as the mean body weight ± SD. P-values were calculated using Student’s t-test. *p < 0.05; **p < 0.01
Primers used for RT-PCR amplification and sequencing of goose astrovirus isolate AAstV/Goose/CHN/2017/SD01