
Figures & data
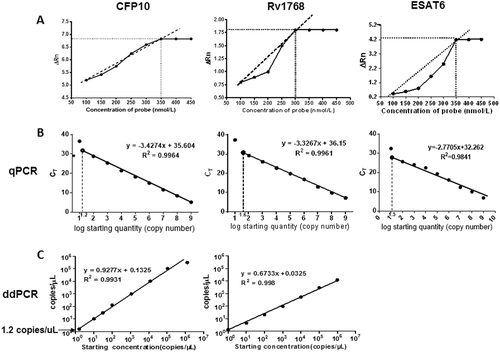
a Optimum concentrations of CFP-10, Rv1768, and ESAT6 probes. Each sample was analyzed in three repetitive wells in one reaction, and each experiment was repeated three times. b Using qPCR, the CFP10 linear regression formula was y = −3.4274x + 35.604 (r2 = 0.9964), the Rv1768 linear regression formula was y = −3.3267x + 36.15 (r2 = 0.9961), and the ESAT-6 linear-regression formula was y = −2.7705x + 32.262 between the plasmid copy numbers and Ct values. c The linearity range of ddPCR for quantifying pET28a-CFP10 and pET28a-Rv1768 plasmid DNA. The formulae were y = 0.9277x + 0.1352 (r2 = 0.9931) for CFP10 and y = 0.6733x + 0.0325 (r2 = 0.998) for Rv1768.
Each sample measured three times and each point represents the mean result of replicates. Each line (red or black) represents one monkey. ANOVA was used to compare the experimental data from qPCR and ddPCR. Differences were considered statistically significant for p < 0.05. a-c: for CFP10; d-f: for Rv1768. a-f have been provided in the figure legend.
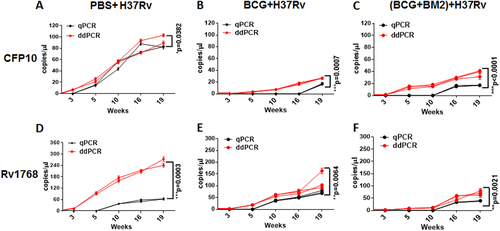
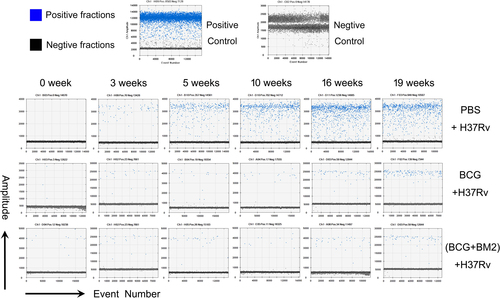
Fig. 3 Representative data of the original microdrop pictures of the CFP10 ddPCR results forM. tb-infected RMs
Clinical characteristics of study participants
Comparison between ddPCR and qPCR for TB diagnosis in the clinical blood samples