Figures & data
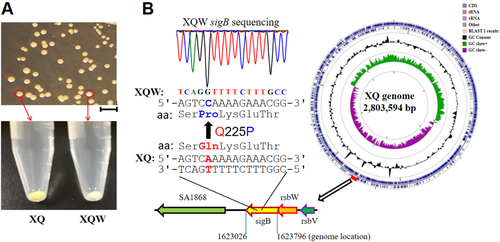
a XQ strain was cultured with LB medium, and the white colonies were observed on an LB plate. The nonpigmented phenotype was stable in the common TSB medium and was termed XQW strain as indicated. b Genome comparison revealed the SigB(Q225P) mutation in XQW. XQ contained the wild-type sigB gene, located approximately at 7 o’clock of its circular genome, whereas XQW contained a missense mutation in sigB(A674C), corresponding to a Q225P substitution in SigB factor, which was further confirmed by PCR amplification and DNA sequencing
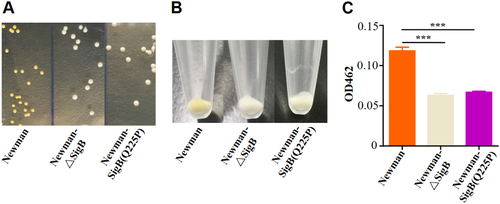
a Colonies of Newman, Newman-ΔSigB, and Newman-SigB(Q225P) on TSB plates. b Cell pellets of Newman, Newman-ΔSigB, and Newman-SigB(Q225P) from TSB cultures. c Carotenoids produced by Newman, Newman-ΔSigB, and Newman-SigB(Q225P) were extracted, and the OD462 value was determined (n = 3). ***P < 0.001
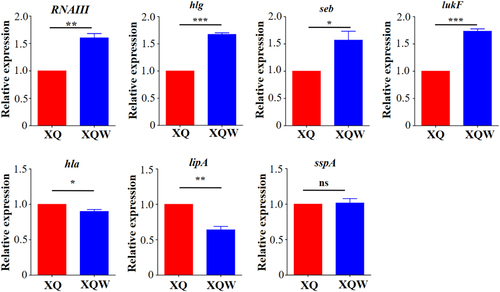
Expression of each gene of interest in XQ strain was normalized to the 16S RNA gene expression and adjusted to 1.0, and its relative expression in XQW strain was indicated. *P < 0.05, **P < 0.01, ***P < 0.001, and ns represents no significance, n = 3
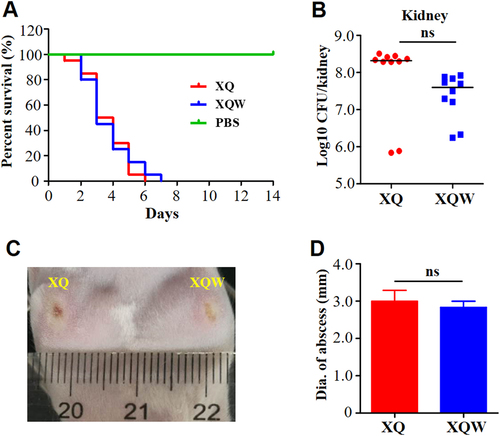
a Survival analysis. Mice were injected through tail vein with 4 × 10⁷ CFU of XQ, XQW, or PBS, and the survival rates were calculated. Number of mice used: n = 10. b Bacterial loads. Mice were injected through tail vein with 1 × 10⁷ CFU of XQ or XQW; bacterial load in the kidney tissue was counted four days post-injection. c Skin abscess formation. The hairs on the back of the mice were removed using 6% Na2S, then mice were respectively injected with XQ and XQW on each side. The skin abscesses were photographed 10 days after injection. d Diameter of abscess area was measured and represented as mean ± SD (n ≥ 3); ns represents no significance
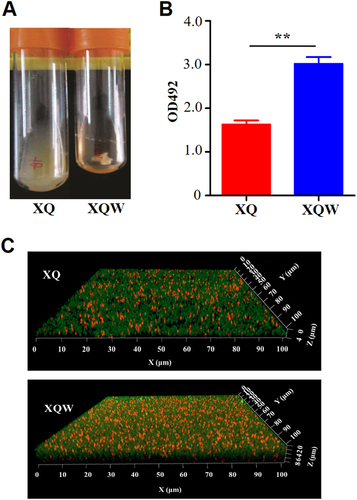
a XQW strain exhibited flocculent growth in LB medium. b Detection of biofilm formation with crystal violet staining method. The OD492 values were represented as mean ± SD (n = 3). **P < 0.01. c Biofilms derived from XQ and XQW strains were observed under a confocal scanning laser microscope. The polysaccharides in biofilm were stained green, and the bacteria were stained red. XQW produced thicker and more compact biofilm than XQ
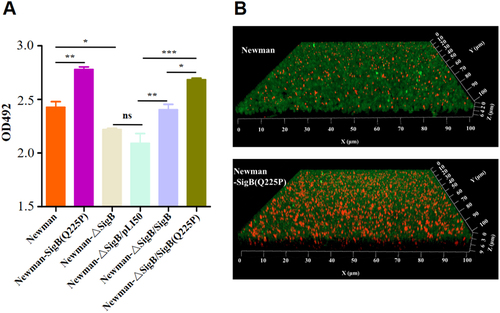
a Crystal violet staining method. Biofilms derived from Newman and its derivatives were stained with crystal violet, and the OD492 was detected (n = 3). *P < 0.05, **P < 0.01, ***P < 0.001, and ns represents no significance. b Observation of biofilm under a confocal microscope. Biofilms produced by Newman and Newman-SigB(Q225P) were indicated. The polysaccharides in biofilm were stained green, and the bacteria were stained red. Newman-SigB(Q225P) exhibited stronger biofilm developing ability than Newman
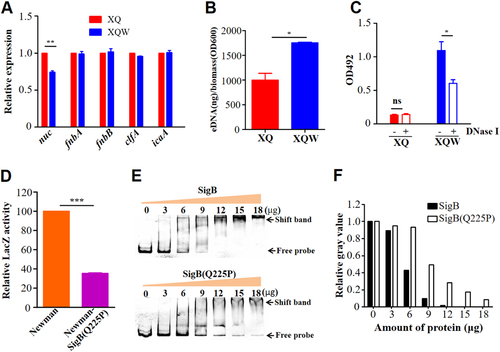
a RT-qPCR detection of the expression level of nuc, fnbA, fnbB, clfA, and icaA genes in XQ and XQW. Only the nuc expression was reduced in XQW strain. **P < 0.01. b eDNA was extracted and determined. XQW biofilms contained more eDNA than XQ. *P < 0.05. c DNase I treatment experiment. The biofilm formation in XQW was significantly reduced after co-incubation with DNase I compared with Tris buffer (20 mM, pH 7.5), whereas biofilm formation in XQ was not changed. *P < 0.05. d β-galactosidase assay. The pOS1-nuc promoter-LacZ reporter plasmid was transformed into Newman and Newman-SigB(Q225P), respectively. The LacZ activity was detected and represented as mean ± SD (n = 3). ***P < 0.001. e EMSA. Interaction between nuc gene promoter and SigB or SigB(Q225P) proteins was detected. The amount of free DNA probes and the shift bands were arrow-indicated. f Evaluation of gray value of the free probe in each lane using ImageJ software. The value of free probe in first lane (0 μg protein) was adjusted to 1.0, and the relative gray values in other lanes were calculated and indicated
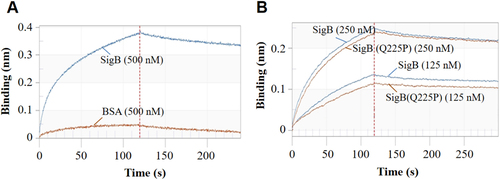
a The specificity of the system. BSA served as negative control. b SigB and SigB(Q225P) proteins interacted with nuc promotor in a dose-dependent manner