Figures & data
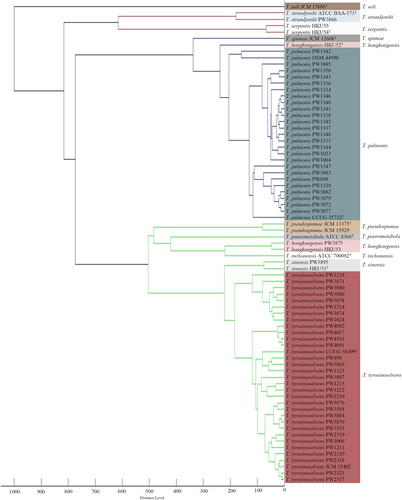
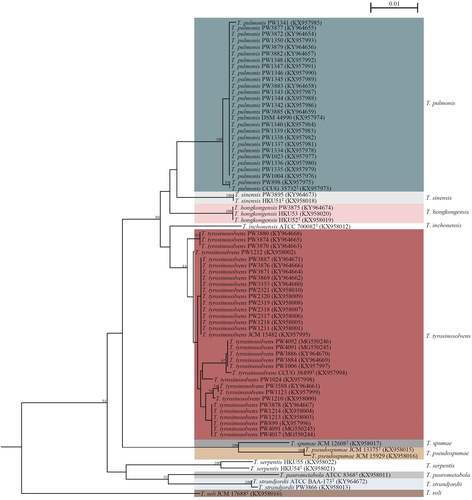
The tree was inferred from partial groEL sequence data (677 nucleotide positions of the trimmed sequence alignments respectively) by the maximum-likelihood method using the model GTR + I + G and Mycobacterium smegmatis MC2 155 (CP009494.1) as the outgroup. The scale bar indicates the estimated number of substitutions per base. Numbers at nodes indicate levels of bootstrap support calculated from 1000 trees and expressed as percentage. All names and accession numbers are given as cited in the GenBank database
Summary of Tsukamurella species isolated from different clinical specimens
MALDI-TOF MS results of 75 Tsukamurella species and 14 species of closely related genera using Bruker database and extended in-house database
The intensity in arbitrary units [a.u.] are shown on the y axis, and the masses (m/z) of the ions are shown on the x axis. The m/z values represent the mass-to-charge ratios
![Fig. 2 MALDI-TOF MS spectra of T. tyrosinosolvens, T. pulmonis, T. hongkongensis, T. strandjordii, and T. sinensis.The intensity in arbitrary units [a.u.] are shown on the y axis, and the masses (m/z) of the ions are shown on the x axis. The m/z values represent the mass-to-charge ratios](/cms/asset/31172c27-bd6b-4200-9d42-c63bb557b912/temi_a_12039990_f0002_ob.jpg)
Distances are displayed in relative units