
Figures & data
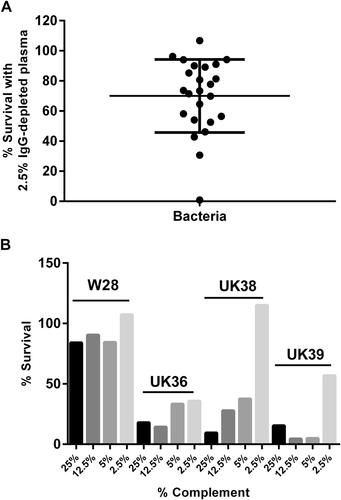
Fig. 1 a Percentage of survival of B. pertussis strains when incubated with 2.5% IgG-depleted human plasma for 1 h. Bars = mean and standard deviation. b Percentage of survival of B. pertussis strains, Wellcome 28 (W28), UK36, UK38 and UK39, following incubation with either 25, 12.5, 5 or 2.5% IgG-depleted human plasma for 1 h
Characteristics of the strains used in this study
Fig. 2 Antibody-independent deposition of complement components a C3b/iC3b, b C5b-9, c C1-INH, d FH and e C4BP onto a group of B. pertussis isolates (n = 16). Each value is the mean of two determinations and the error bar is the standard deviation. Black bars below the x axis indicate groups of isolates characterised as very closely related and clustering on a SNP-based dendrogram (**p < 0.001 and *p < 0.05 by T-test)
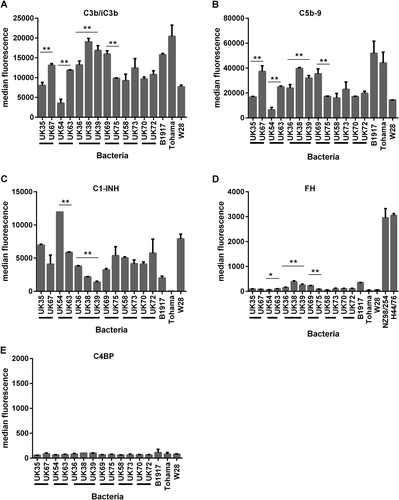
Fig. 3 a Correlation of antibody-independent complement deposition of C3b/iC3b and C1-INH onto a group of B. pertussis isolates, n = 16 (r = −0.91, p < 0.001). b Correlation of antibody-independent complement deposition of C3b/iC3b and C5b-9 onto a group of B. pertussis isolates n = 16 (r = 0.88, p < 0.001)
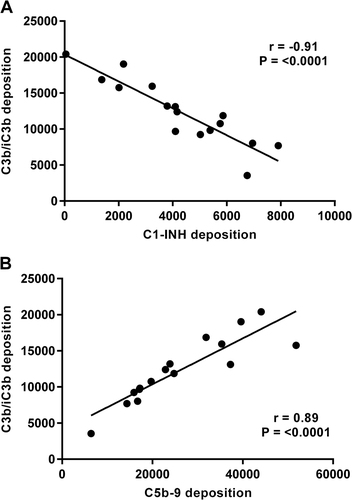
Fig. 4 Correlation of antibody-independent deposition of C3b/iC3b (r = −0.74, p < 0.001) (a), C5b-9 (r = −0.78, p < 0.001) (b) and C1-INH (r = 0.74 p < 0.05 (c) with percentage of survival following incubation with 2.5% IgG-depleted human plasma on a group of B. pertussis isolates (n = 16)
Fig. 5 a Vag8 expression correlated with the deposition of C1-INH on a panel of B. pertussis isolates n = 30 (r = 0.82, p < 0.001). b Percentage of survival of B. pertussis B1917 WT and Vag8 knockout mutant in 2.5% IgG-depleted human plasma and dilutions of NIBSC 06/140 human serum compared with the no antibody control
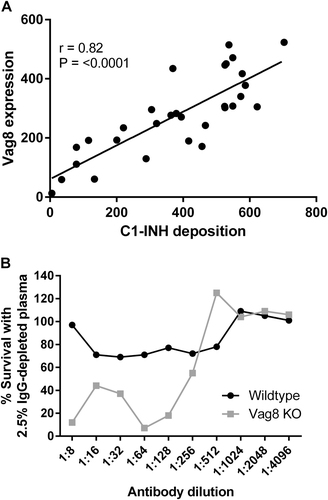
Fig. 6 a ELISA measuring Vag8-specific antibody in 60 Ptx IgG-negative non-convalescent and Ptx IgG-positive (convalescent) sera (**Mann–Whitney test p < 0.01). b Effect on C1-INH deposition following pre-incubation of B. pertussis UK61 (high Vag8-expressing strain) or UK25 (low Vag8-expressing strain) with either Ptx IgG-positive convalescent sera (n = 30) or Ptx IgG-negative non-convalescent sera (n = 30) (**p < 0.001 and *p < 0.05 by T-test)
Primers