Figures & data
Basic information and characterization of 28 HIV-1 B/B′ clones
Hollow circles (○) represent B strains from China; solid circles (●) represent B′ strains from China; hollow squares (□) represent reference B strains from Thailand; solid squares (■) represent reference B strains from Europe and America; hollow triangles (△) represent reference B strains from China; solid triangles (▲) represent subtype 01_AE_CN strains from China; hollow diamonds (◊) represent reference 08BC strains from China; and solid diamonds (♦) represent reference 07BC strains from China. The numbers on the nodes are bootstrap values, which indicate branch support on the phylogenetic tree. Only bootstrap values >80% are shown
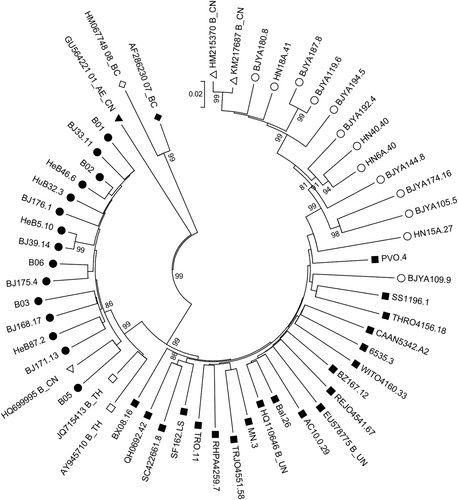
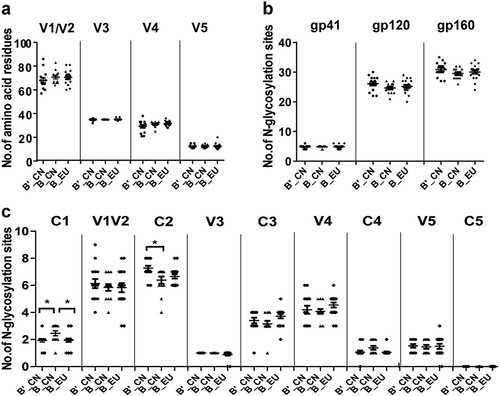
Fig. 2 Comparison of the number of amino acid residues in the variable loops (a) and the number of potential N-linked glycosylation sites (b, c) in the subtype B′_CN (n = 15), B_CN (n = 13), and B_EU (n = 18) env sequences
Neutralization susceptibility of the pseudoviruses to sCD4 and bnmAbs
Fig. 3 Comparison of the neutralizing phenotypes of sCD4 and 16 broadly neutralizing monoclonal antibodies (bnmAbs) against 46 env clones (a–q). *p < 0.05, **p < 0.01, and ***p < 0.0001
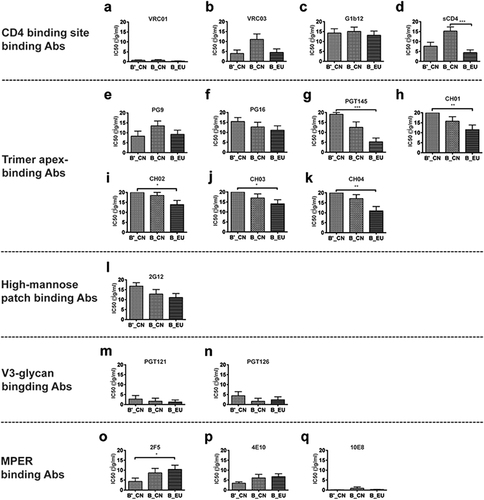
Fig. 4 Comparison of the neutralizing activities of HIV-1 B/B′, CRF07/08_BC, and CRF01_AE plasmas against 46 HIV-1 pseudoviruses (*p < 0.05, ***p < 0.0001) (a). Neutralizing sensitivities of HIV-1 B/B′ and subtype B_EU pseudoviruses compared with those of the subtype BB′, CRF07/08_BC, and CRF01_AE plasma panels (b–d). *p < 0.05, **p < 0.001, and ***p < 0.0001
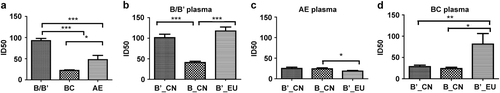
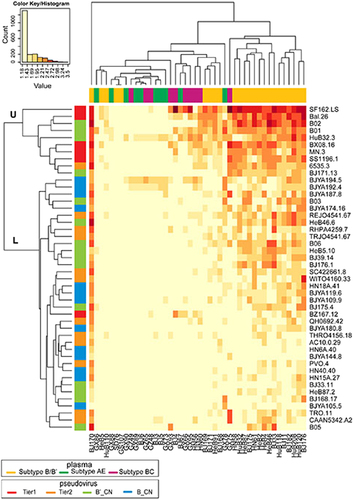
Fig. 5 Heatmap to analyze the relationship of neutralization sensitivity between the plasma panel and pseudovirus panel