
Figures & data
Details of samples collected for SIVs testing in Guangxi
Fig. 1 Phylogenetic trees of the HA H1 (a), NA N1 (b), HA H3 (c), NA N2 (d), M (e), NS (f), PB2 (g), PB1 (h), PA (i), and NP (j) genes of the H1N1 and H3N2 influenza lineages. The unrooted trees were generated with the MEGA 7.0 program by using neighbor-joining analysis and reliability of the tree was assessed by bootstrap analysis with 1000 replications. Neighbor-joining bootstrap values ≥70 are shown at the major branches of the trees. The 12 trees were rooted to A/Brevig_Mission/1/18(H1N1). Viruses shown in black were downloaded from available databases. The isolates in our study were marked in different color, consistent with Fig.
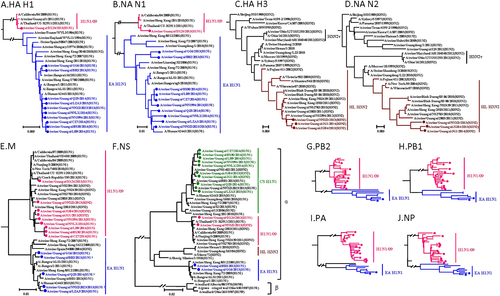
Origin of each gene segment is colored for representing the different lineages
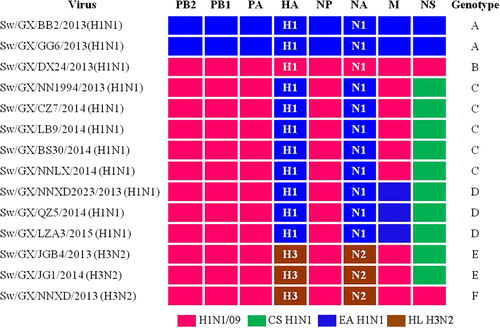
Genome similarity of H1N1 novel reassortant viruses compared with the human isolated A/Hunan/42443/2015(H1N1)
Amino acid substitutions in the novel H1N1 and H3N2 reassortant isolates compared with human isolates
Seroprevalence of antibodies against different swine influenza virus in pigs in Guangxi from 2009 to 2013
Fig. 3 Weight variation (a), survival rates (b), and replication (c) of novel reassortant IAVs-S in mice. Mice in each group were infected intranasally with 5 × 10⁴ TCID50 of virus in a volume of 50 µL. The body weight and survival rates of mice were measured over 14 days. Virus titers of lung on 3 and 5 days post infection (d.p.i.) were shown as the mean titers of three mice