
Figures & data
VEGF (LEFT) and sVEGFR-2 (RIGHT) were measured in samples obtained in the first week of illness (initial samples). UP: plasma samples; DOWN: urine samples. VEGF and sVEGFR-2 levels are shown as log10 pg/ml. Dashed lines indicate 95% confidence interval levels in the control group. The statistical comparison was made for all patients (regardless of virus) vs. controls
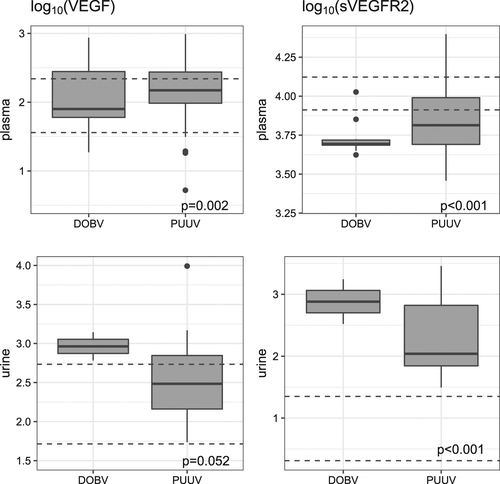
VEGF and sVEGFR-2 levels in plasma and urine samples in HFRS patients
Association between VEGF/sVEGFR-2 levels and diuresis/platelet count in serially measured plasma and urine samples from patients with HFRS
Daily plasma kinetics (LEFT; DOBV [UP], PUUV [DOWN]). Concomitantly collected plasma and urine (RIGHT; DOBV [UP], PUUV [DOWN]) samples were available from 21 patients (19 infected with PUUV, 2 with DOBV). Levels of VEGF are shown as log10 pg/ml. The horizontal line represents mean levels in the control group; dashed lines indicate 95% confidence intervals. Each dot represents one measurement in a tested patient
![Fig. 2 Kinetics of plasma VEGF and comparison of the kinetics in paired (plasma and urine) samples concomitantly collected; relation to different hantavirus species.Daily plasma kinetics (LEFT; DOBV [UP], PUUV [DOWN]). Concomitantly collected plasma and urine (RIGHT; DOBV [UP], PUUV [DOWN]) samples were available from 21 patients (19 infected with PUUV, 2 with DOBV). Levels of VEGF are shown as log10 pg/ml. The horizontal line represents mean levels in the control group; dashed lines indicate 95% confidence intervals. Each dot represents one measurement in a tested patient](/cms/asset/63f1cb40-002e-44ea-bcaa-e26a3101d661/temi_a_12039997_f0002_ob.jpg)
Daily plasma kinetics (LEFT; DOBV [UP], PUUV [DOWN]). Concomitantly collected plasma and urine (RIGHT; DOBV [UP], PUUV [DOWN]) samples were available from 21 patients (19 with PUUV, 2 with DOBV). Levels of VEGF are shown as log10 pg/ml. The horizontal line represents the mean level in the control group; dashed lines indicate 95% confidence intervals. Each dot represents one measurement in a tested patient
![Fig. 3 Kinetics of plasma sVEGFR-2 and comparison of the kinetics in paired plasma and urine samples concomitantly collected; relation to different hantavirus species.Daily plasma kinetics (LEFT; DOBV [UP], PUUV [DOWN]). Concomitantly collected plasma and urine (RIGHT; DOBV [UP], PUUV [DOWN]) samples were available from 21 patients (19 with PUUV, 2 with DOBV). Levels of VEGF are shown as log10 pg/ml. The horizontal line represents the mean level in the control group; dashed lines indicate 95% confidence intervals. Each dot represents one measurement in a tested patient](/cms/asset/a3f68f8f-7b0a-43fe-8363-be2dbb4747b5/temi_a_12039997_f0003_ob.jpg)