
Figures & data
a Immunofluorescence assays to survey SFTSV infection in Vero cells from each passage. The images taken from different passages showing the virus proliferation derived from the 1:40 dilution are presented. Cells immunostained by green fluorescence indicated that they were infected by GTV. P1, the first passage; P3, the third passage; P5, the fifth passage; and P7, the seventh passage. b EM analysis of GTV particles purified from the cell culture supernatants. The supernatants were harvested from Vero cells infected with GTV after 5 days p.i. and were centrifuged and filtered to remove the cell debris. The clarified supernatants were subjected to ultracentrifugation. The fractions containing viral particles were harvested and used in negative-staining EM analyses. c The image obtained by TEM show that virus particles were located in cytoplasm of infected Vero cells. The enlarged images of interest show virus particles from (b) and (c) are shown on the right. N, nucleus; C, cytoplasm; and NM, nuclear membrane
Fig. 2 The ML phylogenetic tree of phleboviruses built based on the complete sequences of the L (a), M (b), and S (c) segments. The branches of five groups of Phleboviruses are labeled with different colors. GTV is labeled with a black solid circle and shown in bold red characters. HRTV sequences are indicated by bold black characters. SFTSV sequences are shown in bold characters, and five genotypes are distinguished by different colors: C1 in green, C2 in chocolate, C3 in khaki, C4 in purple, and J in cyan. Trees were constructed using Mega 5.0 and tested by the bootstrap method with 1000 replications. Bootstrap values greater than 50% are shown at each node
a Immunofluorescence assay to detect the susceptibility of different cell lines derived from monkey (Vero), dog (DH82), mouse (BHK-21), and different human tissues (293 and Hep G2 cells). The mock infection was used as the negative control. b The one-step growth curve of GTV and SFTSV in different cell lines. Cells were infected with GTV or SFTSV at an MOI of five TCID50 units per cell. Supernatants were harvested at the indicated time points, and the viral titers in supernatants were determined as described
The reporter assays were performed using the egfp reporter plasmid system. NP expression in each test was immunostained with α-SNP or an HA tag. Cell nuclei were stained with Hoechst 33258. The eGFP expression was visualized under an inverted fluorescence microscope
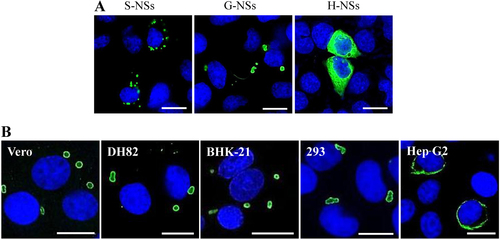
a The NSs distribution in cells was observed by IFA in 293 cells transfected with NSs expression plasmids. G-NSs, GTV NSs; S-NSs, SFTSV NSs; and H-NSs, HRTV NSs. b GTV NSs-induced IB formation was observed in cell lines from different hosts. NSs expression in cells was detected by IFA. Bars, 15 μm
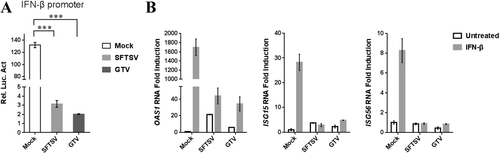
a GTV infection inhibits IFN-β-triggered activation of the ISRE promoter. 293T cells were co-transfected with the IFN-β reporter and pRL-TK plasmids. At 12 h post transfection (p.t.), cells were mock infected or infected with SFTSV or GTV. After 8 h, cells were treated with SeV for another 16 h, after which luciferase activities were measured. The relative luciferase activities (Rel.Lucif.Act.) were expressed as the firefly luciferase activity normalized to Renilla luciferase activity. b GTV infection suppressed IFN-induced gene expression. 293T cells were mock infected or infected with SFTSV or GTV for 24 h and then treated with IFN-β (200 U/ml) or left untreated for 10 h. Expression of ISGs was measured by qRT-PCR. Each test was performed in triplicate. Data are presented as the means ± SD
a qRT-PCR detection of GTV RNA copies in sera collected on the indicated day after challenge. Each dot represents the RNA copies per microliter of sera from each mouse. Data are presented as the means + SD. b IgM and IgG antibody expression in sera from mice collected on the indicated day after challenge. Sera were twofold serially diluted using an end-point dilution assay. The titers are expressed as reciprocals of the dilution, the OD values from which are three time higher than the negative control. The antibody titers are shown with the corresponding symbols with means ± SD. c The pathological changes in organs from mice infected with GTV or SFTSV. Representative H&E staining tissue sections are presented, including for the brain, kidney, liver, and lung. Areas of interest are enlarged on the right, and significant changes are indicated by arrows. d Identification of GTV and SFTSV antigen expression in mouse brains. GTV NP and SFTSV NP expression was identified by IHC in the brains of mice at day 14 post infection. Representative images are shown, and the areas of interest are enlarged on the right. The neurons expressing viral antigen or being sieged by microglial cells are indicated by arrows. Bars, 50 μm
Background information and results of serological examination of the human serum samples from Guertu County