Figures & data
Internal transcribed spacer (ITS) sequences of nuclear rDNA of Candida auris, C. auris closely related species, and Schizosaccharomyces pombe were used. The GenBank accession numbers are shown in the brackets. Candida species used: C. duobushaemulonii, C. pseudohaemulonii, C. haemulonis, C. tropicalis, C. dubliniensis, C. albicans, C. parapsilosis, and C. orthopsilosis. The Maximum-Likelihood phylogenetic tree was generated using RAxML based on the General Time Reversible (GTR) model and Gamma distribution with Invariant sites (G + I). The percentages of replicate trees in which the associated taxa clustered together in the bootstrap test (1000 replicates) are indicated at the branches. The scale bar indicates the nucleotide substitutions per site. Strain BJCA001 is highlighted in blue

Antifungal susceptibility testing of Candida auris BJCA001
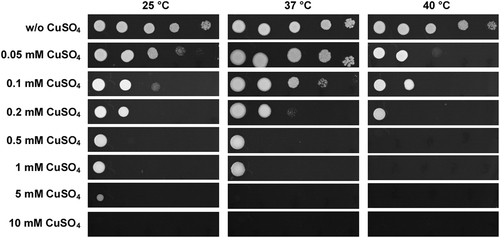
C. auris cells were adjusted to 5 × 10⁸ cells/mL, and then 10-fold serial dilutions of cells (2 μL) were spotted onto YPD and YPD containing CuSO4 media for four days of growth
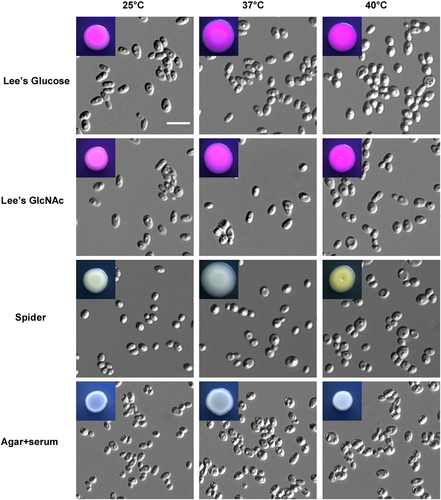
Cells (1 × 10⁵) were spotted onto different medias and cultured at 25 °C, 37 °C, and 40 °C for five days. Scale bar, 10 μm
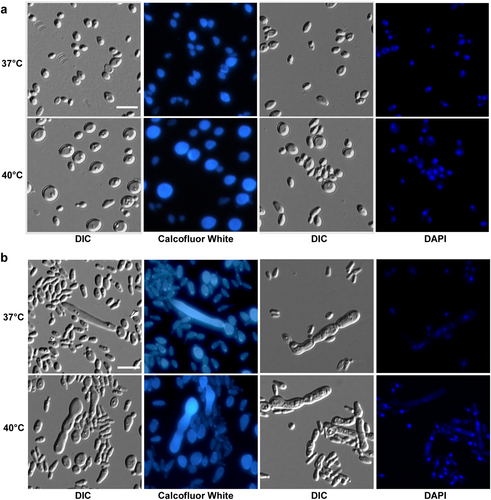
Cells (1 × 10⁵) were spotted onto different medias and cultured at 37 °C and 40 °C for five days. Cells were collected and stained with DAPI or Calcofluor white. Scale bar, 10 μm. DIC, differential interference contrast
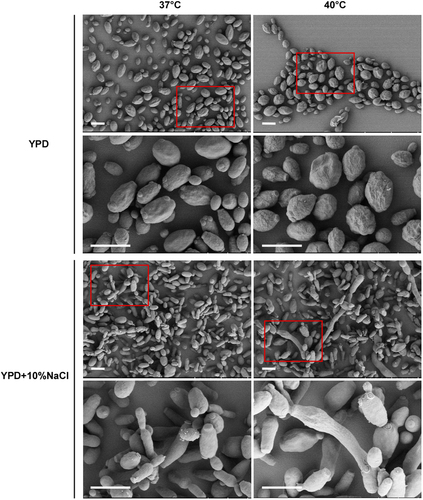
Cells (1 × 10⁵) were spotted onto different media and cultured at 37 °C and 40 °C for five days. Cells were then collected for SEM assays. Scale bar, 5 μm
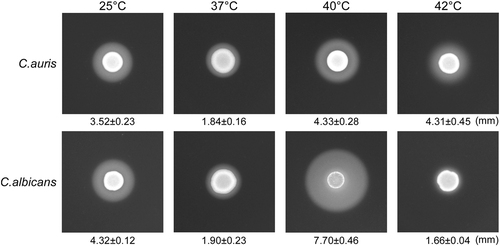
We spotted 5 × 10⁶ cells of C. auris or C. albicans (SC5314) in 5 µL ddH2O onto YCB-BSA medium plates, followed by growth at 25 °C, 37 °C, 40 °C, and 42 °C for five days. The white precipitation zones (halos) around the cell spots indicate Sap-mediated BSA hydrolysis. The width of the precipitation zones is indicated below the corresponding image. Average values of three biological repeats and standard deviations are presented
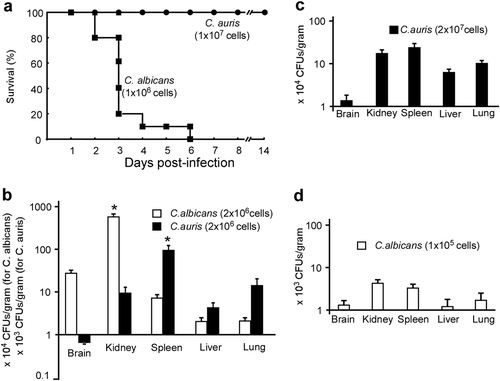
a Survival curves of mice injected with C. auris (1 × 10⁷ cells/mouse) and C. albicans (1 × 10⁶ cells/mouse) via the lateral tail vein. Ten mice were used for each strain. b–d Fungal burden assays. Five mice were used for each infection group. Mice were killed for CFU assays at 24 h post-infection. b Each mouse was injected with 2 × 10⁶ cells of C. auris or C. albicans. c Each mouse was injected with 2 × 10⁷ cells of C. auris. d, Each mouse was injected with 1 × 10⁵ cells of C. albicans. * Indicates a significant difference (P vale < 0.01, Student’s t-test, two-tailed) compared with the fungal burden in other organs