
Figures & data
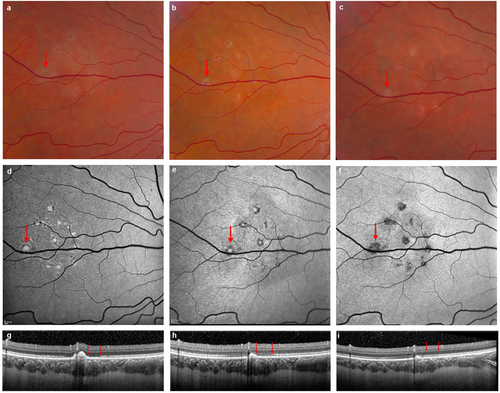
a, b, c Fundus photos illustrate the evolution of outer retinal lesions with increasing pigmentation over time. d, e, f Fundus autofluorescence (FAF) images corresponding to outer retinal lesions show hyperautofluorescence at the initial presentation that becomes hypoautofluorescent by 5 months, indicating partial resolution with RPE atrophy. g, h, i Spectral domain OCT confirms the outer retinal location of lesions with nodular hyperreflective elevated spots corresponding to each hyperautofluorescent lesion. The OCT illustrated here represents images across the largest lesion (indicated by arrow on FAF, Fig. 1d). One and 5 months after onset there is spontaneous partial reconstitution of outer retina with resolution of some lesions, whereas some lesions result in atrophy. Note that the outer retina immediately adjacent to the largest lesion shows reconstitution of the ellipsoid zone by 5 months concurrently with the resolution of the nodular elevation on OCT (two red arrows). Note that images corresponding to onset and 1 month follow-up correspond to a previously reported patientCitation6 and are provided here as reference for month 5
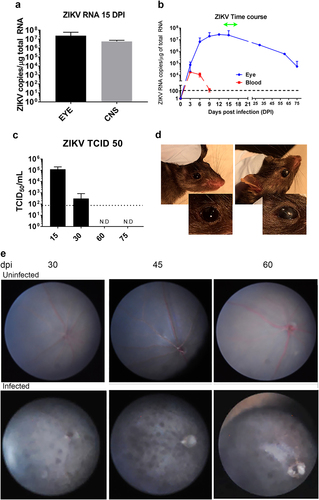
a Levels of viral RNA in CNS and eye at 15 dpi (mean ± SD, n = 6; p = ns); b Levels of viral RNA in whole blood and eye homogenates over time. ZIKV RNA was measured in the blood, brain, and eye of B6wt mice (mean ± SD, n ≥ 3 mice/time point) using quantitative real-time PCR. Values are presented as number of viral RNA copies/microgram of total RNA. Green line represents the period when mice display ataxia and seizuresCitation29. c Levels of infectious ZIKV was measured by TCID50 assay using eye homogenates from ZIKV-infected mice (mean ± SD, n ≥ 3 mice/time point) at 30, 60, and 75 dpi. Dotted line represents lower limit of quantification of the assay. d Opacity of the cornea in ZIKV-infected (30 dpi, right) and age-matched control (left); overall incidence was 12%. Inset shows magnification of the eye; e Fundus image of uninfected age-matched controls (top panels) and ZIKV-infected (bottom panels) B6wt mice showing hypoautofluorescent lesions at 30, 45, and 60 dpi (representative of six mice/time point)
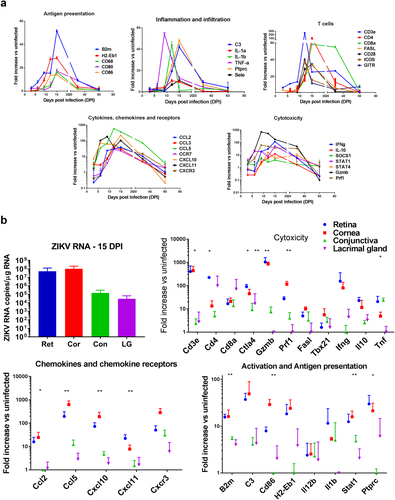
a RNA was isolated from the eye homogenates of B6wt mice 3, 6, 9, 12, 15, 30, and 60 dpi. Relative expression of immune-related genes assessed using a TaqMan mouse immune array and shown as mean fold increase over uninfected, age-matched controls (n = 6/time point). b RNA isolated from retina, cornea, conjunctiva, and lacrimal gland 15 dpi and assessed for viral load by qRT-PCR as well as mRNA expression of immune-related genes. Gene expression was calculated as fold increase over uninfected, age-matched control samples of the same tissue. Mean ± SD, n = 3; Differences between tissues were tested by ANOVA *p < 0.05; **p < 0.01
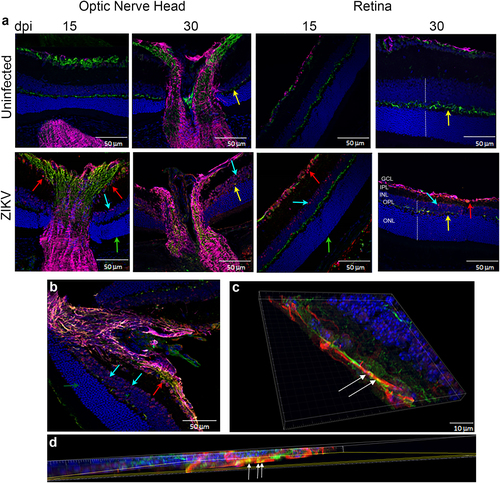
a IF-IHC staining of the optic nerve head and retina with antibodies to DAPI (blue), NF160 (green), GFAP (magenta), and EVU-302 (anti-ZIKV, red) at 15 and 30 dpi. b Higher magnification of optic nerve head at 30 dpi. c, d Confocal imaging of optic nerve head showing colocalization of virus and neuronal staining (white arrows). Red arrow shows virus infection of ganglion cells, Blue arrows show infected cells in inner nuclear layer (INL), green arrow shows uninfected photoreceptor layer (cones and rods), yellow arrows show the outer plexiform layer. Note this layer is reduced in the retina of infected mice. Dotted white lines show the width of the INL and ONL. Note the relative reduction in INL in infected mice at 30 dpi. Images representative of two independent experiments with three mice/group. Note that ZIKV antigen was in 100% infected mice at 15 dpi and 80% of infected mice at 30 dpi. Only 20% of infected mice were positive for ZIKV antigen at 60 dpi. ONL- Outer Nuclear Layer; OPL-Outer Plexiform Layer; INL-Inner Nuclear Layer; IPL-Inner Plexiform Layer; GCL-Ganglion Cell Layer
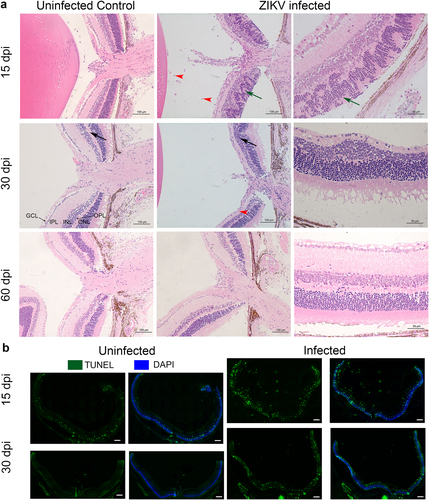
a Histopathology of ZIKV infected Eyes shows distinct retinal folding, vitiritis and choroiditis. H&E staining of sections from B6wt eyes harvested 15, 30 and 60 dpi. Left panels show uninfected age-matched controls. The center panels show histopathology at 15, 30, and 60 days post infection. Right panels show a magnified image of the infected eye of the same mouse. Black arrows indicate the reduction of thickness of the outer plexiform layer. Note that the width is restored at 60 dpi. Green arrows indicate the retinal folding. Red arrowheads point to cellular infiltration. ONL- Outer Nuclear Layer; OPL-Outer Plexiform Layer; INL-Inner Nuclear Layer; IPL-Inner Plexiform Layer; GCL-Ganglion Cell Layer. b Apoptotic cells stained with TUNEL (green) and DAPI (Blue) at 15 and 30 dpi. Scale bar: 200μm. A higher magnification of the apaptosis can be found in Supplementary Figure S5. Images representative of two independent experiments with three mice/group
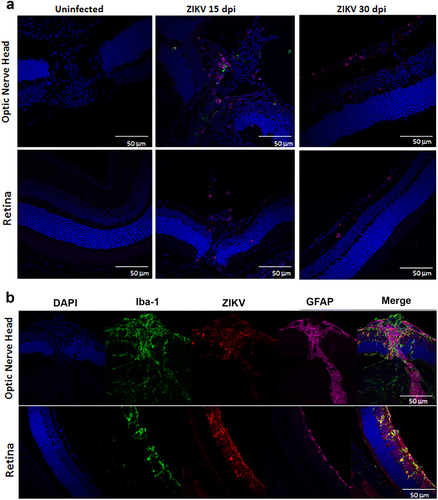
a Infiltration of CD4 and CD11c + cells 15 and 30 dpi. Staining with DAPI (blue), anti-CD4 (red), anti-CD11c (green). b ZIKV colocalizes with microglia 15 dpi. Staining with DAPI (blue), Iba-1 (green), EVU-302 (red), GFAP (magenta) shows virus and Iba+ microglia are evident in the optic nerve and retina. Note colocalization of Iba-1 and EVU-302 and gliosis of surrounding area. Figure representative of three mice/time point with similar images
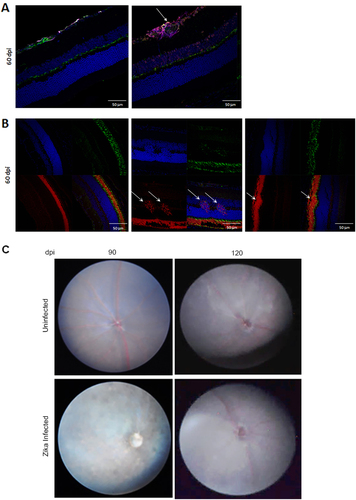
a IHC of retina at 60 dpi stained with DAPI (blue), NF160 (green), GFAP (magenta), and EVU-302. Image shows foci of gliosis that is not stained with EVU-302 indicating absence of viral antigen. b IHC of retina at 60 dpi stained with DAPI (blue), Wheat Germ Agglutinin (WGA) to stain rods (red), and PeaNut Agglutinin (PNA) to stain cones (green). Note that evidence of retinal degeneration (white arrows) modifies the photoreceptor layer. c Fundus imaging of ZIKV infected (bottom panels) and corresponding uninfected age-matched controls (top panels) at 90 and 120 dpi. Note that the vasculature is evident at 120 dpi. N = 3 mice per group