
Figures & data
Chicken and ferret antisera produced for this study
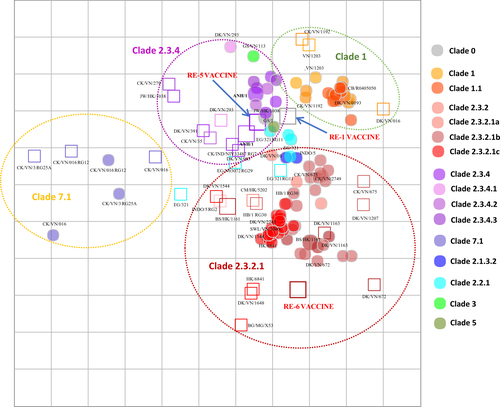
Both vertical and horizontal axes represent antigenic distance. Grid lines represent 1 antigenic distance unit, corresponding to a 2-fold dilution in the HI assay. Different antigenic clusters are indicated with different colors. Filled circles indicate antigens, while open squares indicate antisera
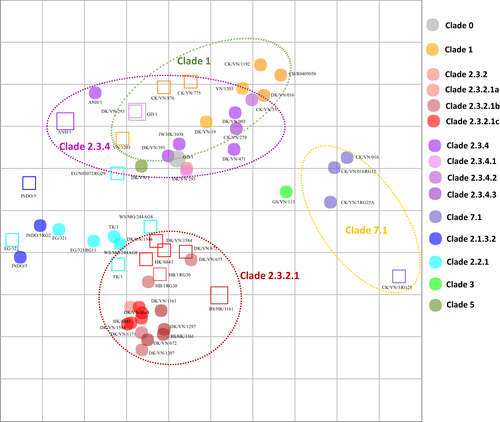
Both vertical and horizontal axes represent antigenic distance. Grid lines represent 1 antigenic distance unit, corresponding to a 2-fold dilution in the HI assay. Different antigenic clusters are indicated with different colors. Filled circles indicate antigens, while open squares indicate antisera
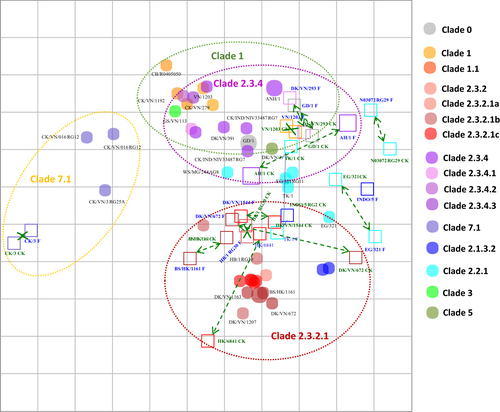
Grid lines represent 1 antigenic distance unit, corresponding to a 2-fold dilution in the HI assay. Different antigenic clusters are indicated with different colors. Filled circles indicate antigens, while open squares indicate antisera. Green arrows with dotted lines indicate chicken and ferret antisera pairs
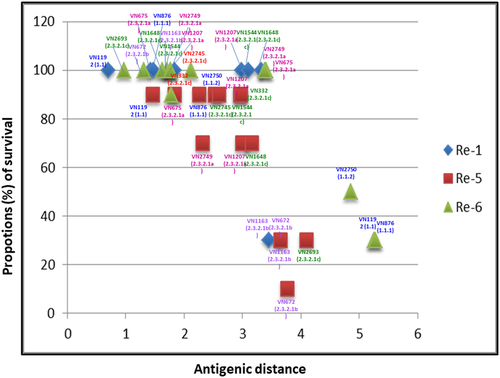
Each data point represents results from a challenge trial using 10 chickens/challenge virus and survival following intranasal inoculation with a dose of 106 TCID50. Blue diamonds, red squares and green triangles represent chickens vaccinated with Re-1, Re-5 and Re-6, respectively. The challenge viruses used are identified for each group of vaccinated chickens with color-coded text indicating strain name and clade
Viruses used in this study