
Figures & data
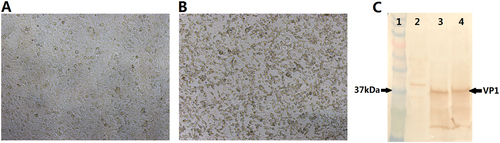
a Control. b Cells infected with the synthetic virus. c Western blotting using anti-EV-D68 VP1 antibodies. Lane1: marker; lane2: cell control; lane3: Fermon virus; lane4: synthetic virus
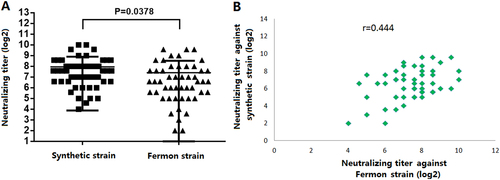
a Comparison of the NtAbs of anti-EV-D68 against the synthetic virus and Fermon (p = 0.0378). b The correlation of NtAbs against EV-D68 between the synthetic virus and Fermon (r = 0.444)
Seroprevalence rates and GMTs of NtAbs from the blood samples of 20 pairs of prenatal women and their neonates
Relationship of EV-D68 NtAbs in blood samples collected from prenatal women and their neonates
a EV-D68 NtAb prevalence (100%) by age group; “n” was the number of the serum samples. b The GMT (positive serum) and seroprevalence rates were evaluated in different age groups
Seroprevalence rates and GMTs of EV-D68 neutralizing antibodies among age groups